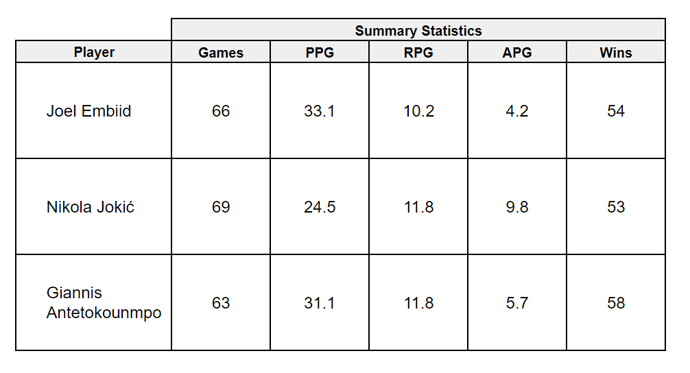
 The contenders' summary stats
.png?width=680&height=262&name=image%20(13).png) The Dataset
The Dataset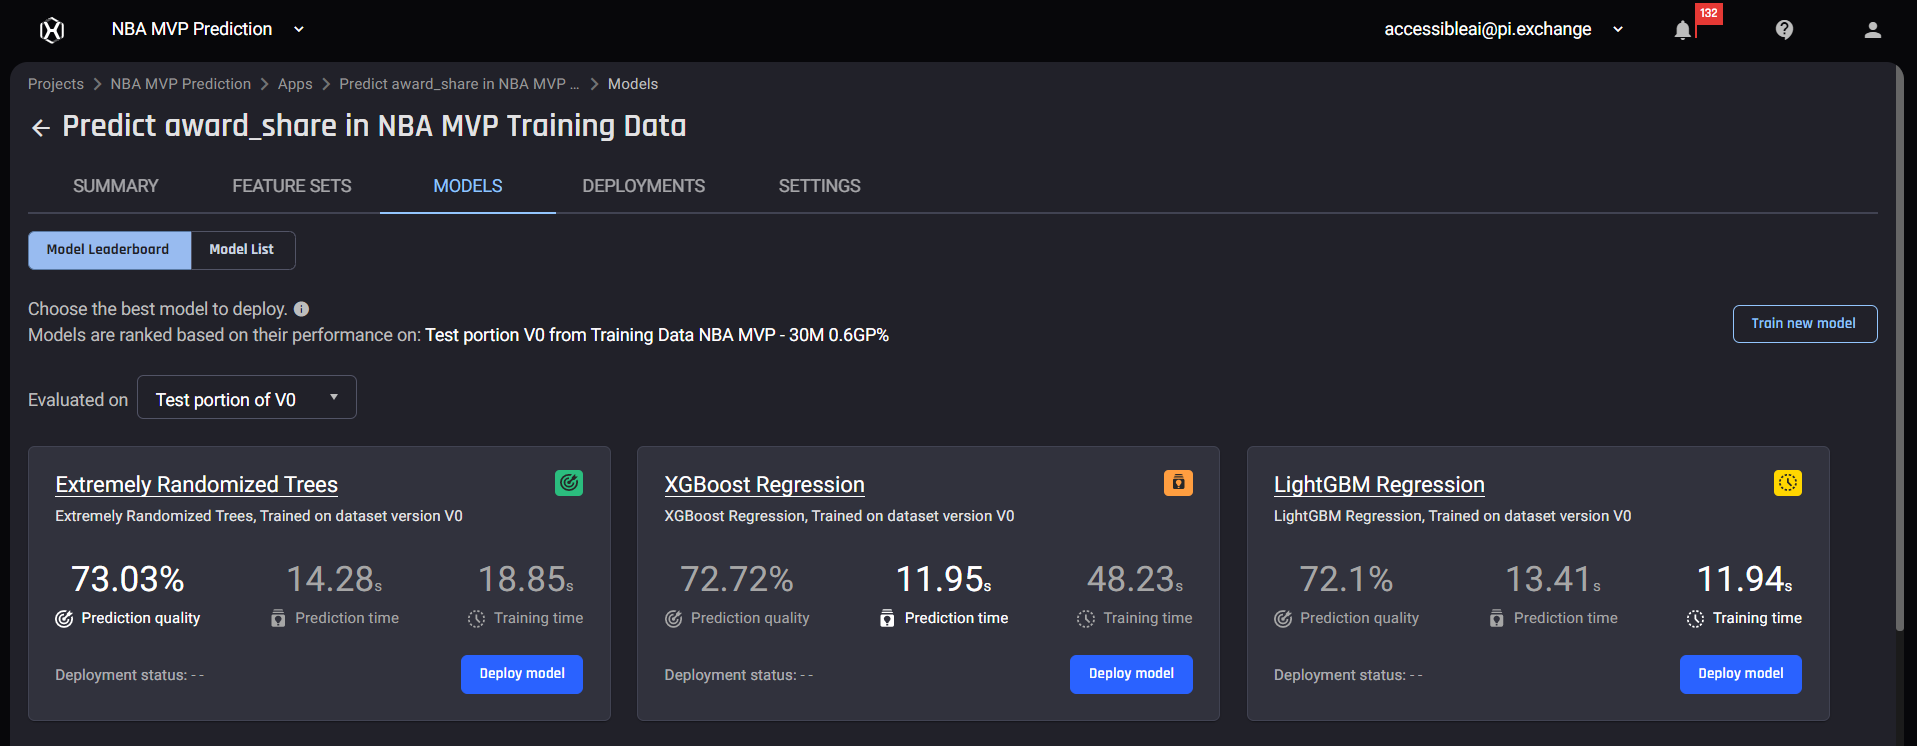 Model Summary in the AI&A Engine
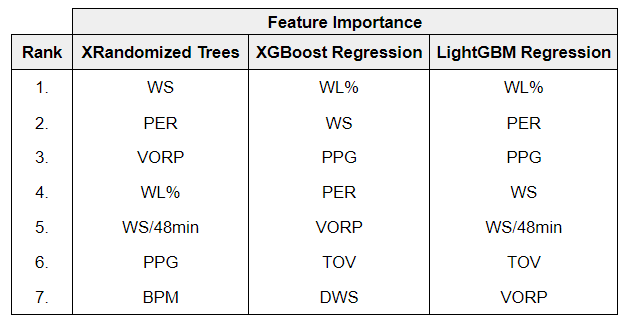 Feature importance of the ML models
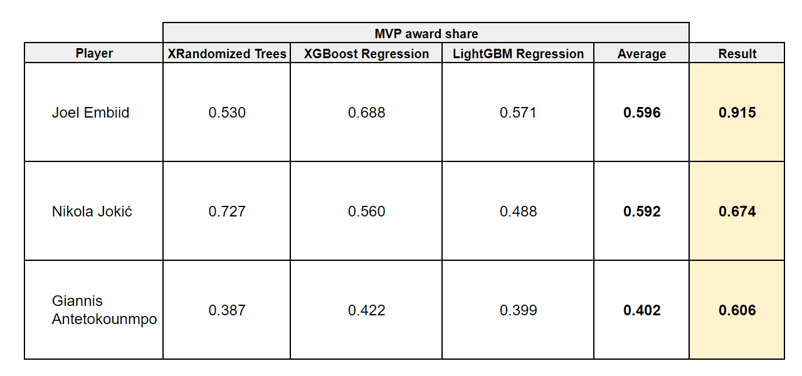

Model Performance
Testing models: Analyzing Batch prediction results using Excel
Analyzing prediction results is critical in evaluating the performance of trained models. We demonstrate how you can use Excel to evaluate your model