The article outlines the steps to generate prediction explanation examples for supervised machine learning models.
Note: Feature importance is only available for successfully trained models
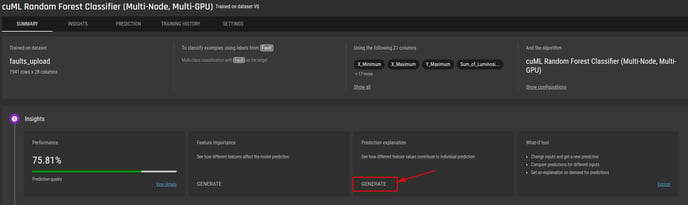
Step 1 - Click the “Generate” button
Users can generate prediction explanation examples at the model summary tab and at the model Insight tab.
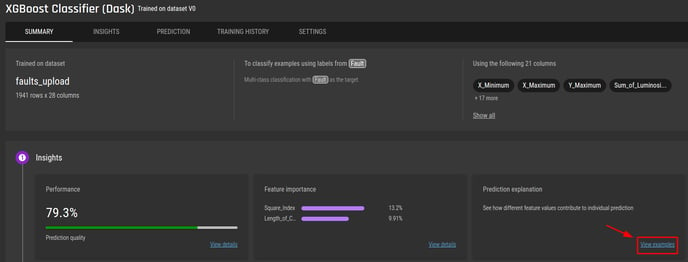
From the model summary tab, click the “Generate” button in the prediction explanation card
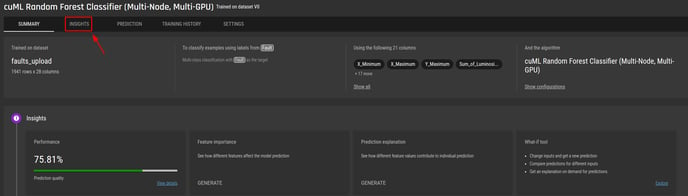
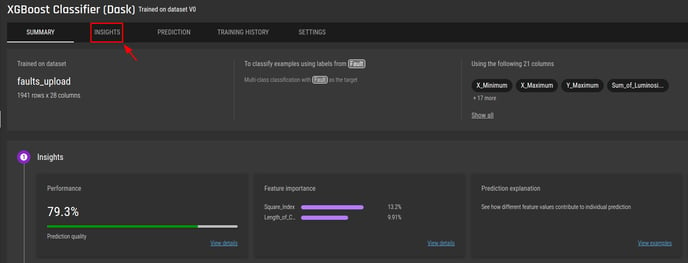
From the model summary tab:
-
Go to Insights
-
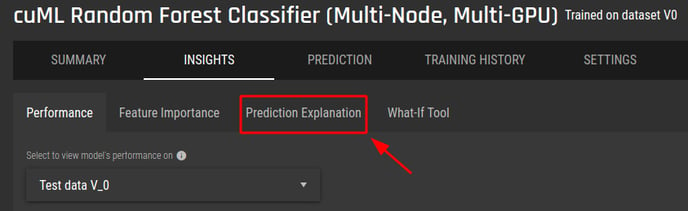
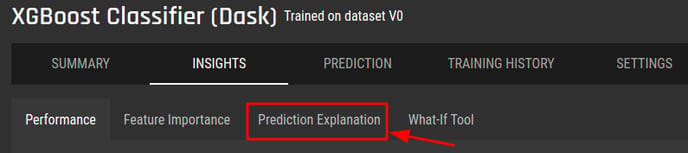
Go to prediction explanation and click the “Generate” button
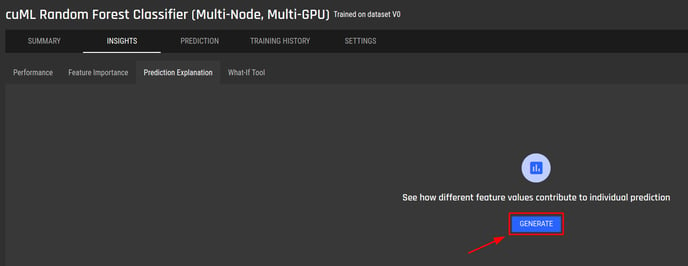
You only need to generate prediction explanation once. Once successfully generated, it will always be available.
When users generate prediction explanation, feature importance will also generated, and vice versa.
Step 2 - Navigate to view the prediction explanation examples
There are 2 ways to quickly navigate to the prediction explanation sub tab:
-
From the model summary tab, click “view examples” in the prediction explanation card
2. From the model summary tab:
-
Go to Insights
-
Go to Prediction explanation
Step 3 - Select and view different examples from the example table
-
Click on a row to select an example from the table on left
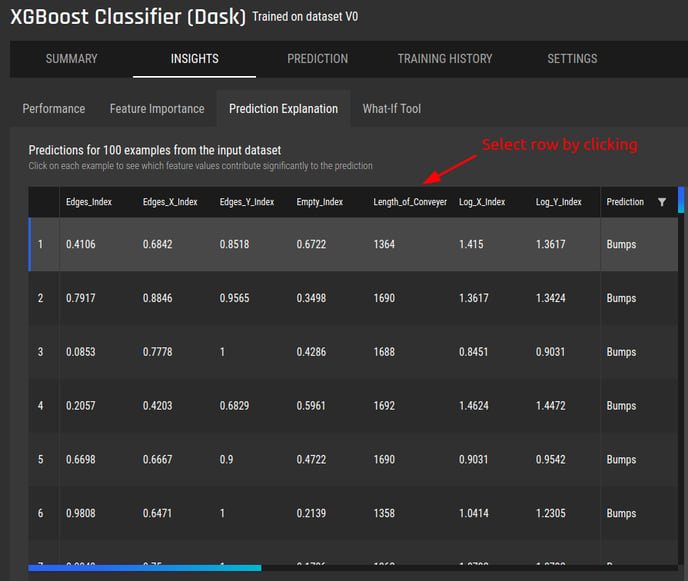
For models that predict a label from a list of labels (multi-class classification), use the filter icon to select one or more labels to show on the table:
-
The output is displayed on the right
-
The output display varies based on the problem type
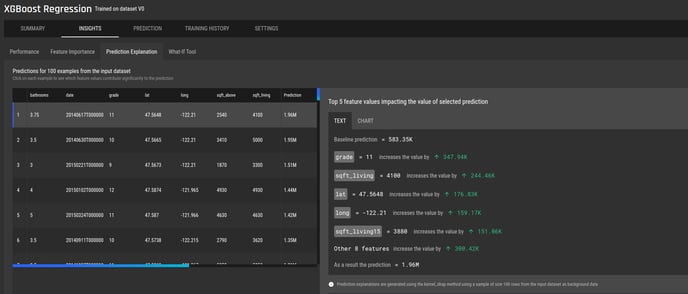 For models predicting a numerical value (regression), the output is the prediction value
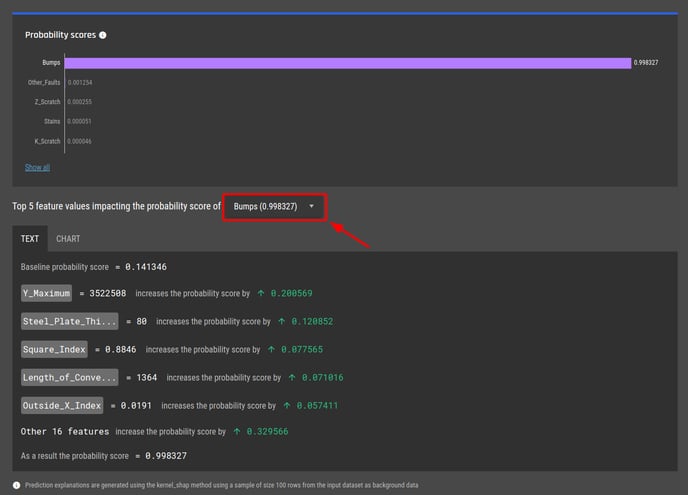
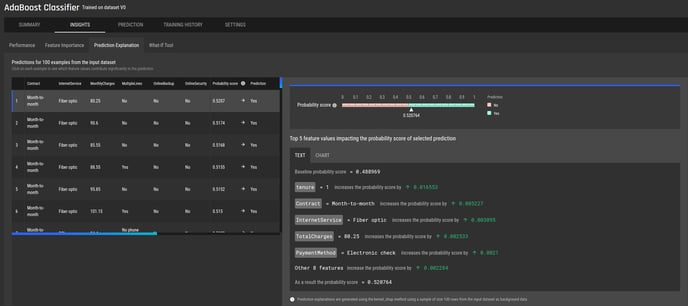 For models answering a yes/no question (binary classification), the output is a probability score
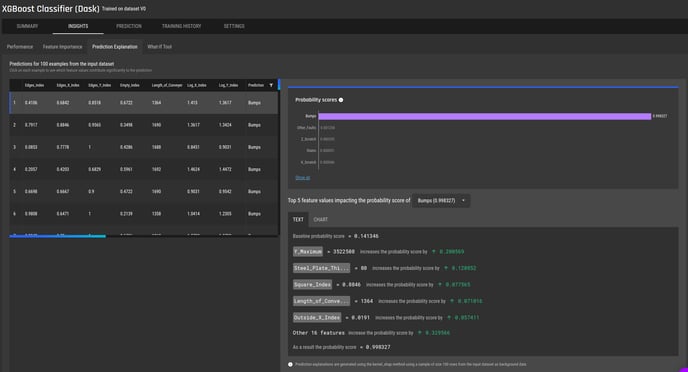 For models predicting a label from a list of labels (multi-class classification), the output is the set of probability scores for each label
-
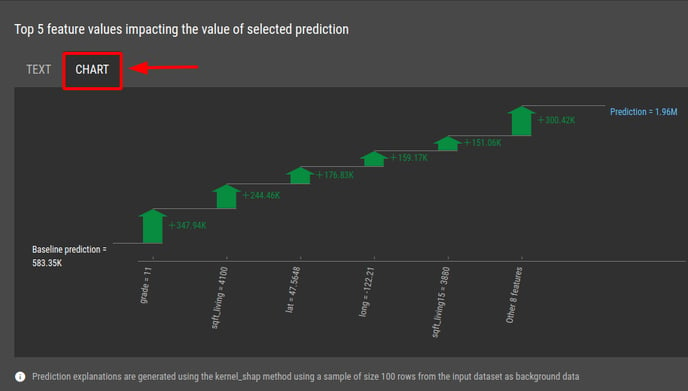
The text explanation is shown by default. To switch to the chart view, click on “Chart”
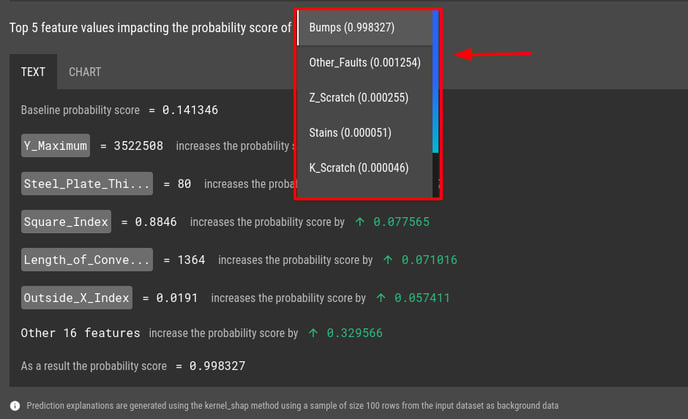
For models that predict a label from a list of labels (multi-class classification), use the dropdown to select a label of interest to view the prediction explanation
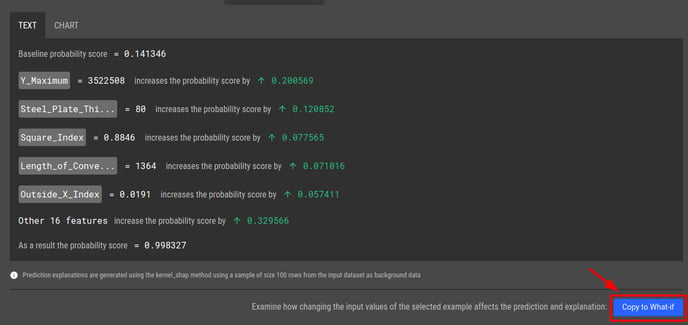
Step 4 - Copy the input values to what-if analysis tool to modify and experiment
To copy the inputs of an example to fill the input fields of the what-if analysis tool, click on the “Copy to what-if” button
To see how to generate prediction explanation using the what-if analysis tool, see this article.