This article explains the metrics used to evaluate a regression model's performance.
On the AI & Analytics Engine, the Performance report for regression models includes the following sections:
-
Summary of basic evaluation metrics
-
Performance breakdown table
-
Detailed metrics table and plots
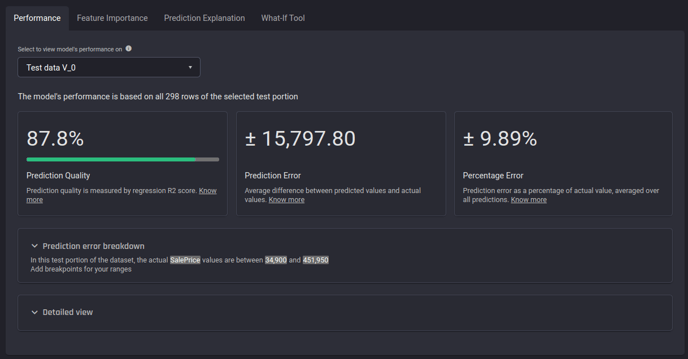 The performance report for a house price prediction problem in the Engine
Summary of basic evaluation metrics
The first section includes a summary of the following three basic evaluation metrics.
|
|
Unit |
Range |
Type |
Best value |
|---|---|---|---|---|
|
Prediction Quality (R2 score) |
% |
0% to 100% |
Higher is better |
100% |
|
Prediction Error (Mean absolute error) |
Same as the prediction target |
0 to infinity |
Smaller is better |
0 |
|
Percentage Error (Mean absolute percentage error) |
% |
0% to infinity |
Smaller is better |
0% |
 Example of Prediction quality, Prediction Error and Percentage Error in the Engine
Prediction Quality (R2 score)
What is Prediction Quality?
The prediction quality is in fact the R2 score (coefficient of determination) multiplied by 100, which results in a percentage value.
How does the R2 score measure the model performance?
R2 score explains how the trained model performs by comparing it with a worst-case baseline model. The baseline model here is one that outputs the average value of the target from the training portion seen by it. For example, if the target column in the training portion had the values 20, 40, and 60, the baseline model will always predict 40, which is the average of 20, 40, and 60. A worst-case baseline model does not take into consideration the values of the input that are fed to it.
The comparison is done by taking the ratio between the "total error of the trained model" and "total error of the baseline model". If the trained model performs better than the baseline, its total error will be smaller and hence the ratio will be smaller than 1. A perfect model would have a ratio of 0 since its total error will be 0. Finally, we obtain the R2 score by simply subtracting the comparison ratio from 1:
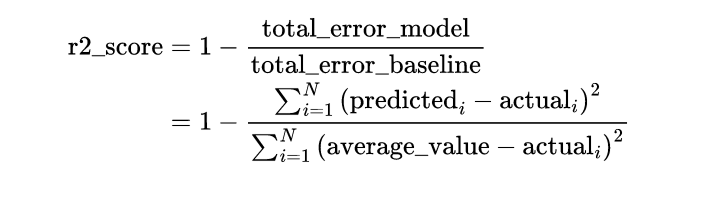
💡 "Total error" is the simplified term for "sum of squared residuals".
How to interpret the R2 score?
-
0 < R2 score < 1: The model performs better than the baseline model. The higher the R2 score, the better the model performs.
-
R2 score = 1: The model predicts perfectly.
-
R2 score = 0: The model performs similarly to the baseline model. In practice, the R2 score can be negative. However, the engine automatically clamps the negative R2 score to 0. Therefore, we can interpret a value of 0 as "performing equally or worse than the baseline model".
🎓 For further details about the R2 score, read coefficient of determination
Prediction Error (Mean absolute error)
What is Prediction Error?
Prediction Error is the mean absolute error metric.
How does the mean absolute error measure the model performance?
The trained model gives a prediction for each example in the test portion. The mean absolute error is the average of the absolute difference between the actual and predicted values:

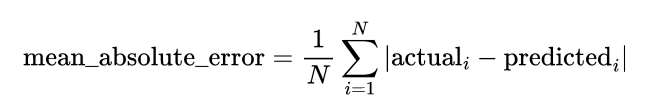
The mean absolute error measures the model performance by telling us how much difference we would expect between a prediction and its actual value.
The mean absolute error will have the same unit as the target values. For example, if we are predicting house prices in dollars, the unit of mean absolute error is dollars.
How to interpret the mean absolute error (MAbE)?
-
MAbE > 0: A smaller MAbE is better. Unlike the R2 score, which is upper bounded by 1, the MAbE does not have an upper bound.
-
MAbE = 0: The model predicts perfectly.
🎓 For further details about mean absolute, read mean absolute error
Percentage Error (Mean absolute percentage error)
What is Percentage Error?
For regression models, Percentage Error is simply the mean absolute percentage error.
How does the mean absolute percentage error measure the model performance?
The trained model gives a prediction for each example in the test portion. The absolute percentage error compares the magnitude of the "error" the model made with the actual value. For example, if the actual value is 1000 and the model predicts 950, the "mistake" will be 1000 - 950 = 50 and the absolute percentage error will be 100 * [50 / 1000] = 5%. The mean absolute percentage error is then the average of all absolute percentage errors:

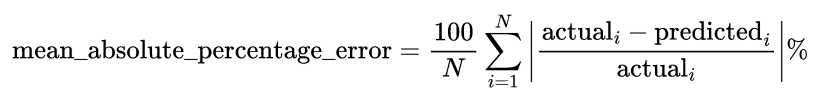
The mean absolute percentage error metric tells us the difference we would expect, relative to the actual value of the target variable, between the model’s prediction and the corresponding actual value.
How to interpret mean absolute percentage error (MAPE)?
-
MAPE > 0: A smaller MAPE is better. The MAPE’s value is not upper-bounded by 100%. The MAPE only expresses the magnitude of difference between the model’s "error" and actual values as a percentage of the actual values. For example, if the model always predicts 3 times the actual value, the MAPE will be approximately 200%.
-
MAPE = 0: The model predicts perfectly.
🎓 For further details about mean absolute percentage error, read mean absolute percentage error
Prediction error breakdown table
This table allows “splitting” the range of actual target values. The approximate number of rows belong to each split and the approximate percentage error are displayed for each split.
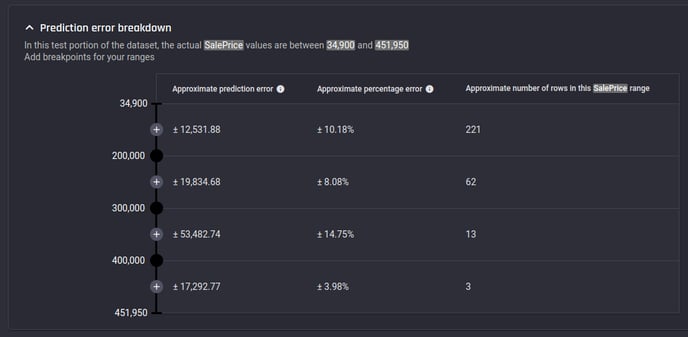 Example Prediction error breakdown table for a house price prediction problem in the Engine
Additional evaluation metrics
-
R2 Score - Used in prediction quality as well and explained above.
-
Explained Variance - Explained variance compares the variance of the difference between the actual and predicted values against the variance of the actual values. The formula for explained variance is as below. The higher the value, the better the prediction with best possible value of 1.0.

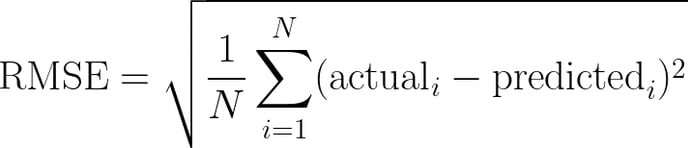
- RMSE - Root Mean Squared Error. The RMSE is the square root of the average of the squared difference between the actual and predicted values. The formula for RMSE is as below. The RMSE will have the same unit as the target values. The lower the value, the better the prediction with best possible value of 0.
-
MABE - Mean Absolute Error. Used in Prediction Error as well and explained above.
-
MedABE - Similar to MABE but calculates median of the absolute difference between the actual and predicted values instead of mean. MedABE will have the same unit as the target values. The lower the value, the better the prediction with best possible value of 0.
![]()
-
MAPE - Mean Absolute Percentage Error. Used in Percentage Error as well and explained above.
-
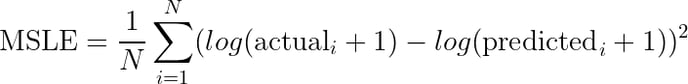
MSLE - Mean Squared Logarithmic Error. The MSLE is the average of the squared difference between logarithm of actual values and the logarithm of predicted values. The formula for MSLE is as below. This metric is useful when the target values are in exponential range such as average sales of different items over the years. The lower the value, the better the prediction.
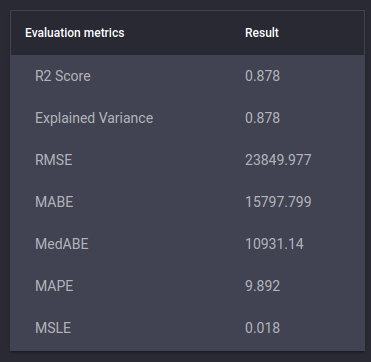 List of metrics for a house price prediction regression problem in the Engine
Plots
There are three useful plots in the Engine to consider when evaluating regression model performance.
-
Scatter plot of Predicted values vs Actual target values - Each point in the plot is an example in the test portion with y-axis showing the predicted value against actual value in the x-axis. Typically, closer the points to the diagonal of the plot (y = x line), better the model performance.
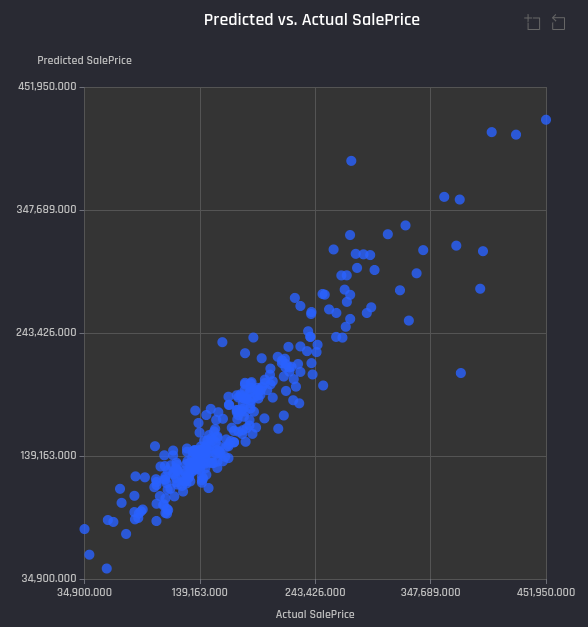 Example Predicted vs Actual values plot for a house price prediction problem in the Engine
-
Scatter plot of Residuals (different between actual value and the predicted value) vs Predicted values - Each point in the plot is an example in the test portion with y-axis showing residual value against predicted value from the model in the x-axis. Typically, closer the points to the horizontal line at residual = 0, better the model performance. The residual plots also help to check:
-
If residuals are correlated with the predicted values - no correlation indicates model performance doesn’t depend on the predicted value.
-
How residuals are distributed - mean, variance.
-
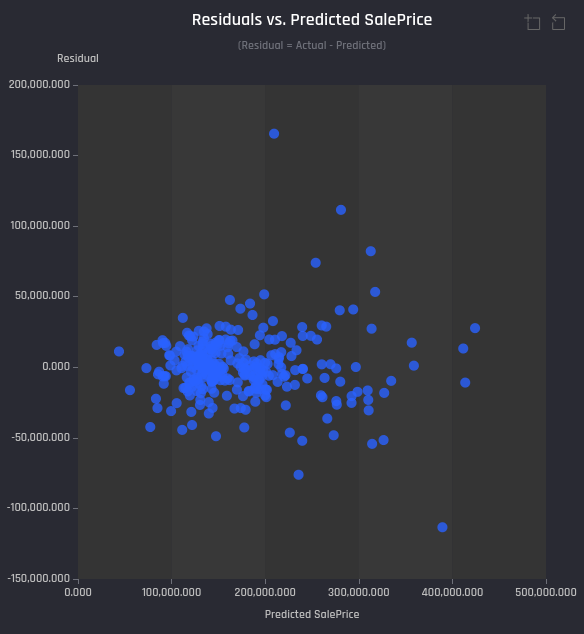 Example Residuals vs Predicted values plot for a house price prediction problem in the Engine
- Distribution of Residuals as a Histogram - The plots shows how residuals are distributed regardless of the actual value. Typically, higher the bars closer to the residual = 0, better the model performance.
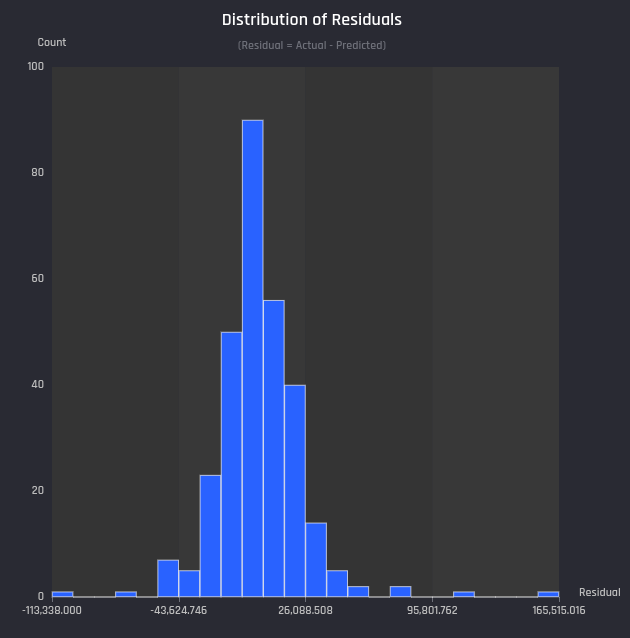 Example Distribution of Residuals plot for a house price prediction problem in the Engine