This article explains what the prediction output contain for apps built using a Machine Learning Solution Templates.
The prediction output of a ML Solution Template app will include specific information tailored to the business requirements, and vary according to the selected template.
🎓To learn more about Machine Learning Solution Templates, read What is an app?
Prediction output of a customer churn prediction app
The prediction output from the customer churn prediction app shows
-
Currently active customers.
-
Customer usage, spend and other characteristics (e.g. the smallest amount credited during last 30 days, average number of customer service calls made in the last fortnight, number of MMS messages sent in the last 28 days, or other contributing factors from the “customer information dataset” specified during the app creation, such as the customer’s birthday).
-
Customer’s predicted churn probability at a given date.
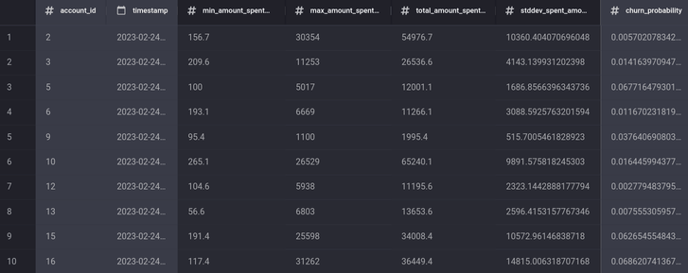 Example prediction output from the subscription-based customer churn prediction app
 Example prediction output from the subscription-based customer churn prediction app
The definition of “active customers” varies based on the churn option.
-
For the transaction-based apps, it is defined as any customer who had at least one transaction since the earliest of the start dates of the rolling date ranges chosen in the contributing factors section.
-
For the subscription-based apps, it is defined as any customer who hasn’t terminated their subscription, which can be gathered from the latest “subscription start and end dates” dataset.
Prediction output of a customer lifetime value prediction app
Similar to the customer churn prediction app, the prediction output from the customer lifetime value prediction app contains:
-
Currently active customers (i.e., those with at least one transaction/purchase)
-
Customer usage, spend and demographic characteristics, which are the same as in the transactional customer churn prediction template.
-
The customer's predicted lifetime value
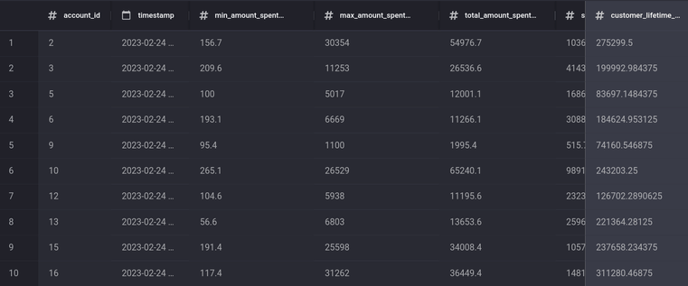
Example prediction output from the customer lifetime value prediction app