This article demonstrates how to use a ML Solution Template to predict the possibility of customer churn, for a transaction-based business.
Introduction
Many businesses face the significant challenge of customer churn. It is crucial to predict churn early so retention initiatives can be put into place proactively.
To address this concern, the AI & Analytics Engine offers a template that uses machine learning to predict customer churn.
The template uses historical customer data and customer activity to make accurate predictions.
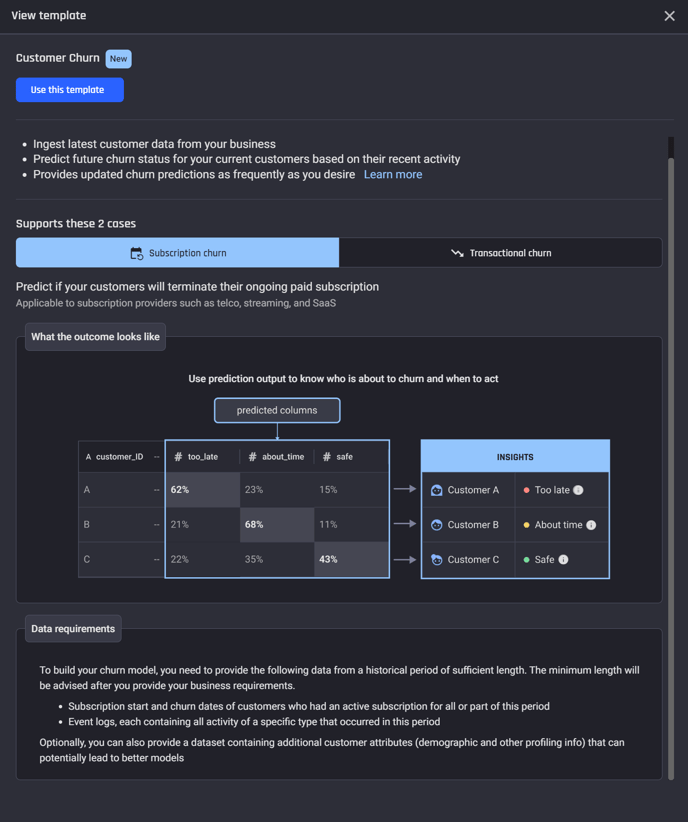
There are two options in the Customer Churn Prediction ML Solution Template:
-
Predicting whether a transactional activity will decline in volume, or frequency for each customer who is currently active
-
Predicting the likelihood of each customer terminating their ongoing paid subscription service
This article will explore the Customer Churn Prediction template for subscription businesses. This refers to businesses with customers that make transactions or individual purchases.
![]() To learn more about the Engine’s template for subscription-based businesses, read how to use the templated ML solution for the subscription option in the customer churn prediction template?
To learn more about the Engine’s template for subscription-based businesses, read how to use the templated ML solution for the subscription option in the customer churn prediction template?
Use case: Predicting customer churn for a telco business
Suppose you're a telco employee who wants to utilize your customer data to initiate a successful customer retention campaign. You aim to identify customers who are likely to leave your service in the near future, so you can target them with retention efforts, resulting in significant cost savings as retaining existing customers is far cheaper than acquiring new ones.
To accomplish this, you use the Engine's subscription-based Customer Churn Prediction template to build a machine learning powered app that identifies customers that are likely to churn.
Data
To demonstrate this, datasets from an example telco use case are used in this article.
💡 Follow this guide along by downloading the datasets.
There are 4 datasets available:
Subscription information dataset
A required dataset that contains subscription information past and current customers' subscription start dates (registration_date) and churn dates (churn_date). If a customer is active, the churn_date will be empty. Each row represents a customer with a unique customer_id.
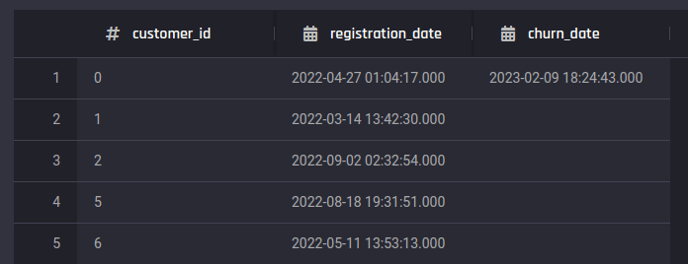 Preview of subscription dataset
Customer service requests dataset
This dataset contains call center records. Each record represents a service request (over the phone) made by the customers (customer_id) and has a timestamp from when they were made. The columns include the details of call_type, call_outcome, call wait times in minutes (wait_time_minutes) and duration (call_duration_minutes).
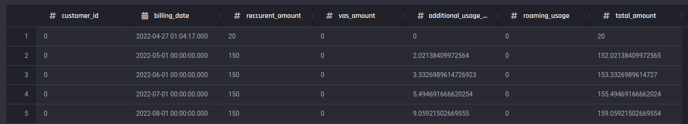 Preview of billing dataset
Customer service requests dataset
This dataset contains call center records. Each record represents a service request (over the phone) made by the customers (customer_id) and has a timestamp from when they were made. The columns include the details of call_type, call_outcome, call wait times in minutes (wait_time_minutes) and duration (call_duration_minutes).
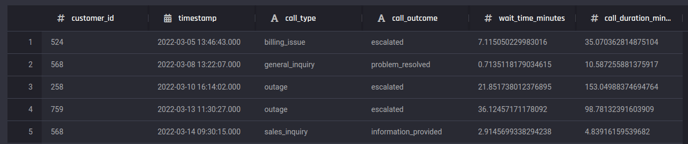 Preview of customer-service requests dataset
Customer information dataset
This dataset contains demographic data each customers (customer_id), such as their date_of_birth and gender.
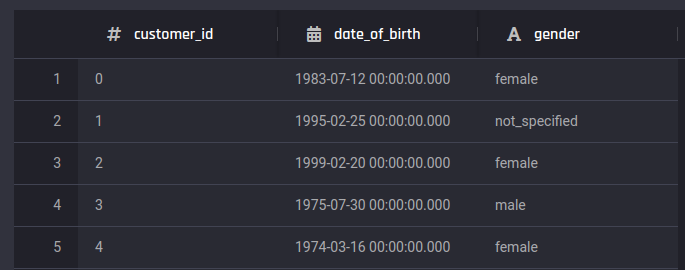 Preview of customer demographics dataset
💡 Adding a customer demographics dataset is optional. It may provide additional signals to improve the performance of the model.
Creating a Customer churn prediction app with the template
In this section, you can follow some simple steps and provide the required information to create an application that uses machine-learning models to predict customer churn.
You’ll observe how this templated solution shortens the time between feeding raw data to getting insightful predictions.
To access the app builder, on the Project Home page, select Customer Churn under Machine Learning Solution Templates.
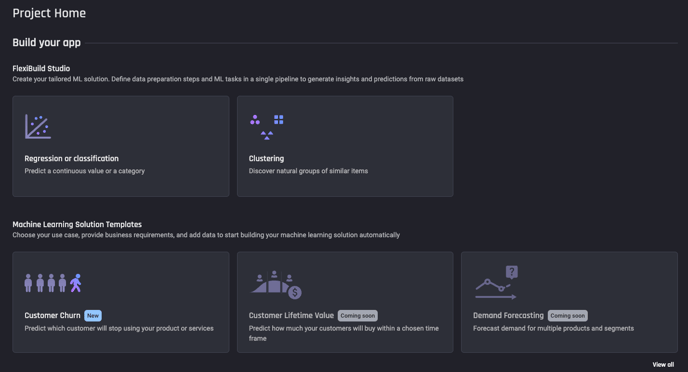 Select Customer Churn
Then create the application by selecting the Use this template and naming the application, this will take you to the App builder pipeline.
Step 1: Select a template that matches your business type
Within the App builder pipeline, choose the option “Predict if my customers will terminate their ongoing paid subscription”.
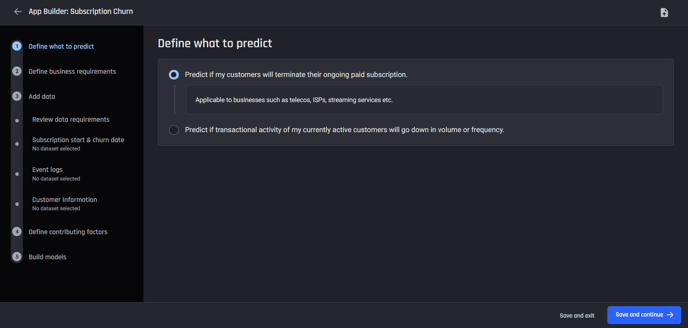 Choose the first option for subscription businesses
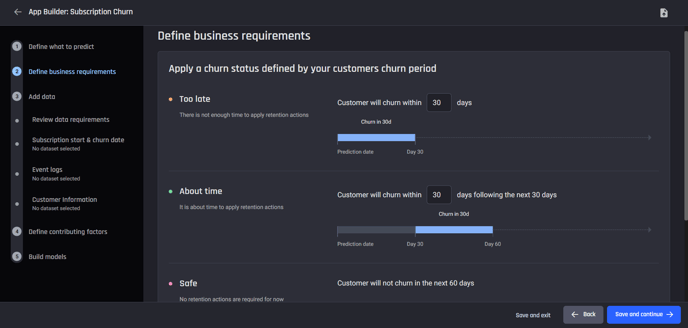
Step 2: Define business requirements
This step is to define your business requirements. This requires an understanding of what churn means to your business and the lead time required to action retention initiatives.
The labels too_late, about_time and safe are labels that are to be predicted using your dataset, this step is about you defining what each of labels mean to your business.
For example, Too late for you might mean that a customer churning within the next 30 day period from the prediction date will be too late for the business to start their retention tactics.
🎓To learn more about defining churn period read what options are available to define churn within the subscription option of the customer churn template?
For this example, define:
-
Too late: Customer will churn within 30 days
-
About time: Customer will churn within 30 days following the next 30 days
Entering these parameters will automatically assign the Safe to customers who are not churning within the Too late and About time prediction windows (60 days).
Select a prediction frequency of 1 month.
 Define churn periods and prediction frequency
Step 3: Review data requirements and import your data
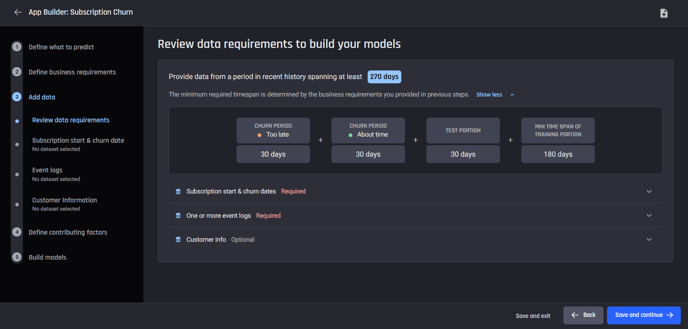
Review the data requirements to build the models. Based on the parameters provided when defining the business requirements, history of data required must span at least 270 days.
This is because of the churn periods you identified for your labels, as well as the test portion defined by the prediction frequency. The Engine then works out a minimum training portion to build the model.
The data you need is:
-
Subscription start and churn dates (required data)
-
One or more event logs (required data)
-
Customer info (optional data)
 Review data requirements
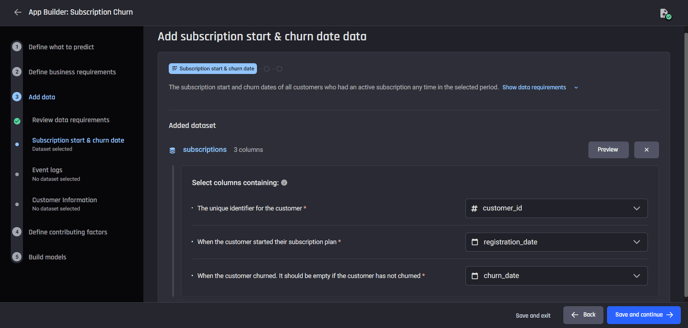
The next step is to add the dataset containing the subscription start and churn dates.
The churn dates for active customers are empty, and each customer should have only one record in this dataset.
You can connect to a database table or upload the data containing this information.
You will need to provide the customer identifier column (customer_id), subscription start date column (registration_start) and the churn_date column.
 Add subscription information dataset
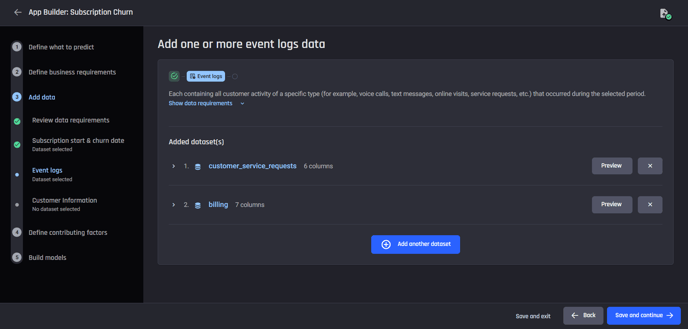
Then add event-logs data, of which type there are two datasets: billing dataset and service_requests dataset.
For each event-logs dataset, you will need to provide a label to designate the type of events it contains, and select the columns containing the customer identifiers and event timestamps.
The event-type label provided here enables the Engine to generate feature names that are relatable to the business use case, in the training dataset to be generated.
 Add customer_service_request dataset and billing dataset
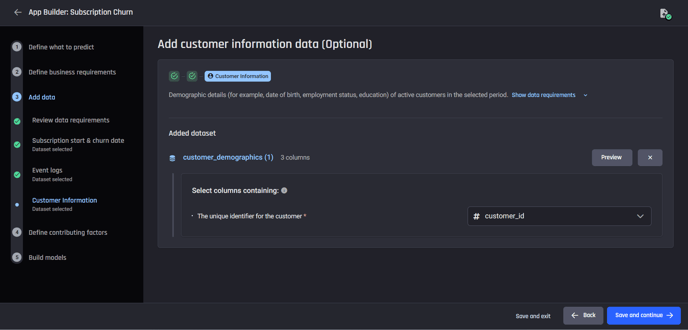
The last dataset you can add is a the optional customer-information dataset. Adding such a dataset about customers might lead to better model quality later.
You need to select the column containing the customer identifiers here as well.
 Add customer information dataset
Step 4: Define contributing factors
Next, define contributing factors that are usually predictive with respect to the likelihood of churn.
🎓 To learn more about contributing factors, read what do "contributing factors" mean in the customer churn prediction template.
Time-based factors from the events datasets
For each event logs dataset, select the columns in the dataset and relevant rolling date ranges that can potentially be used to identify future churn.
For the rolling date ranges windows for the the customer_service_requests dataset use:
-
“Most 30 recent days”
-
“30-day range, 30 days ago”
-
“30-day range, 60 days ago”
For the rolling date ranges windows for the the billing dataset use:
-
“Most 60 recent days”
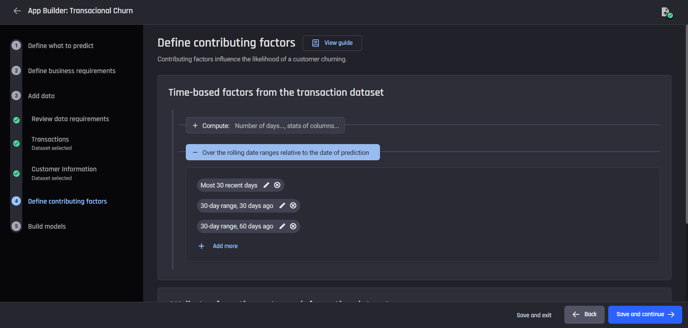 Contribution factors from customer_service_requests dataset. You can define the contribution factors for the billing dataset in a similar way
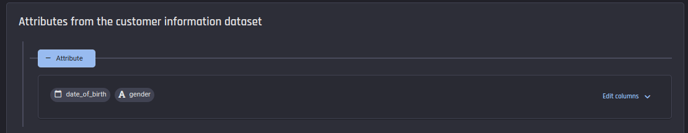
Attributes from the customer information dataset
Use the default selection which is to have all relevant columns selected.
Step 5: Build models
The last step in the App builder pipeline is to select the algorithms for training. You have the option to allow the Engine to automatically identify the best models according to your specified criteria, or you can choose to manually select the algorithms.
For this example select the top 3 algorithms.
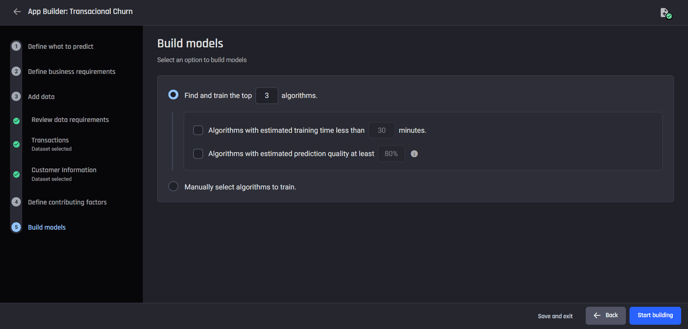 Select machine learning algorithms to be used
The app-building process will start as soon as you complete this step, and the resulting app will allow us to make predictions and explore the model insights.
You will be directed to the App summary page with the label Processing. You can see the progress of the app in each panel.
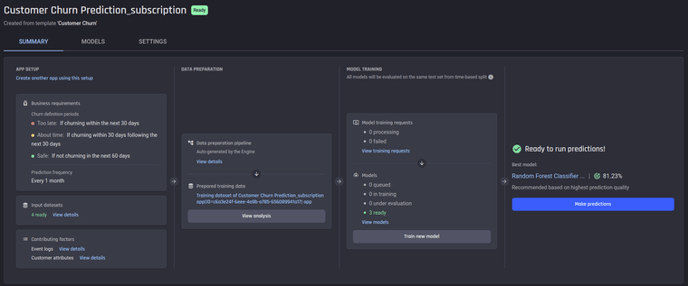 App summary page once app is ready
Analysing Customer churn in historical data
Once the training dataset is complete, you can click View analysis under Data preparation in the App Summary page to see the charts analysing churn in historical data.
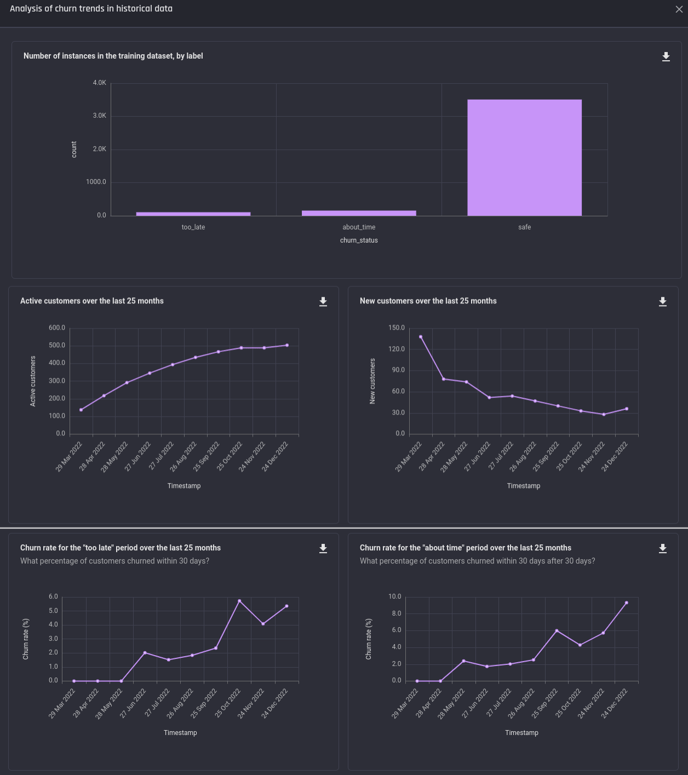 Analysis charts of historical Churn
Accessing model insights
Once the app building process is complete, the models begin training. When the training is complete, Once the app is ready, go to the Model leaderboard page using Models tab. Here you can see a list of trained models and their performances in terms of prediction quality and training times.
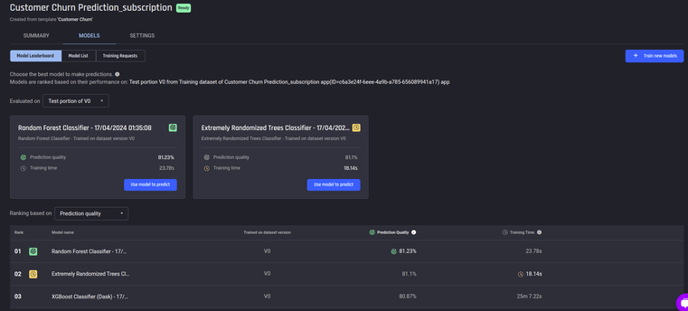 Model leaderboard page
Performance
For more detailed information about the model performance, you can click on the model name, and navigate to the Insights tab, which will display the Performance page, which provides insights on the accuracy of the models predictions.
Included is multiple evaluation metrics, a confusion matrix, and charts of the ROC Curve and Precision Recall Curve.
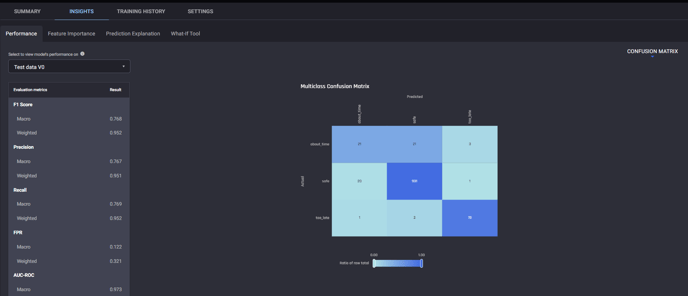 Performance page under Insights tab
Feature Importance
The Insights tab also contains the Feature Importance page, which can provide insight into the most important behavioural predictors for customer churn, and the factors that affect the likelihood of customer churn at a given snapshot in time.
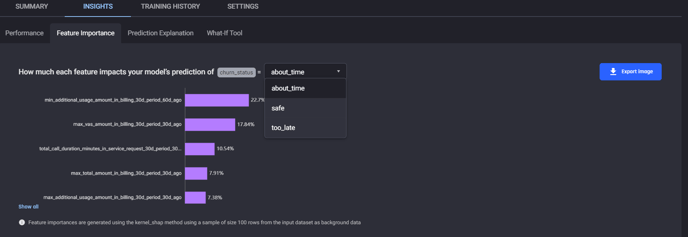 Feature importance page under Insights tab
Prediction Explanation
The next page under the Insights tab is Prediction Explanation. This feature allows you to examine the prediction of a given customer, providing what factors increase or decrease their likelihood of churning, and to what extent.
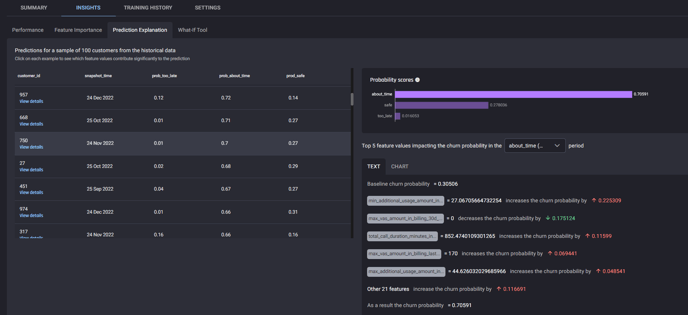 Prediction explanation page under Insights tab
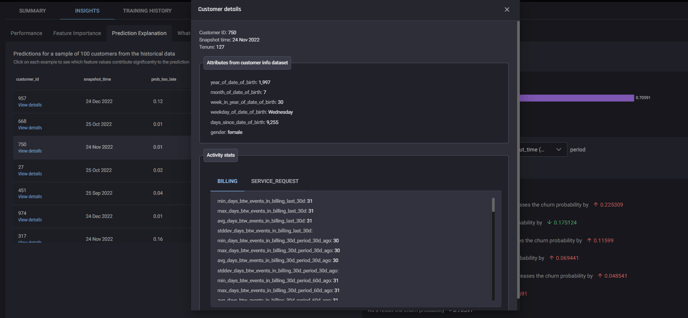 Customer details window, accessible by clicking view details for any customer in Prediction explanation.
Generating Predictions
Predictions from the Customer Churn Prediction ML Solution Template provide following:
-
List of currently active customers
-
Their predicted likelihood of churn in each of the 3 defined time period labels:
-
prob_too_late
-
prob_about_time
-
and prob_safe
-
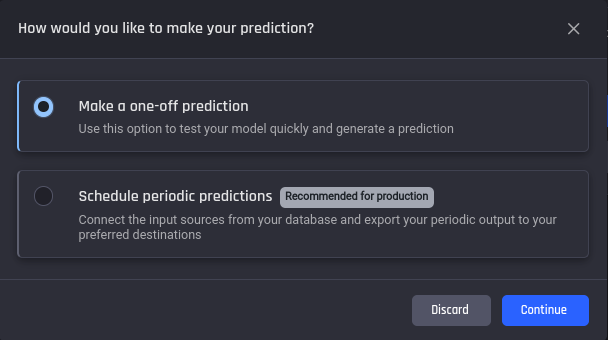
Two options available to make predictions.
-
Make a one-off prediction: You can use this option if you want to test the model quickly or make a single prediction.
-
Schedule periodic predictions: This option enables the use of the ML prediction pipeline built by the template in production, to automatically generate updated predictions periodically, requiring no manual intervention. When you want to schedule churn predictions in this way, you will connect your live customer data to the Engine, to periodically ingest new data available since the last prediction and generate the latest predictions. The first step is to setup a database connection (e.g. mysql database) that allows querying the relevant tables periodically, and fetch the data required to generate new predictions.
🎓For more information about these prediction options, read What are the options for predictions in the customer churn prediction template.
Make a one-off predictions
There are three steps to set up a one-off prediction.
1. Select the model
Use the recommended model which is the model with the highest prediction quality.
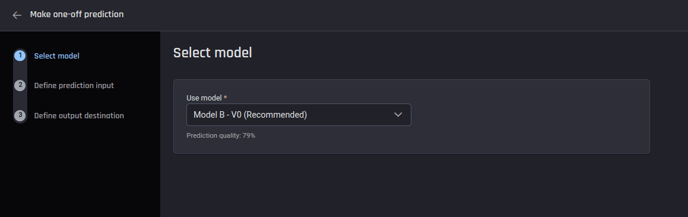 Select the model to generate predictions
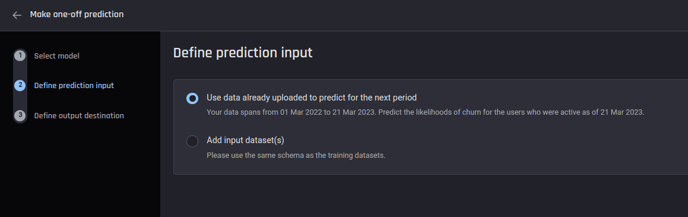
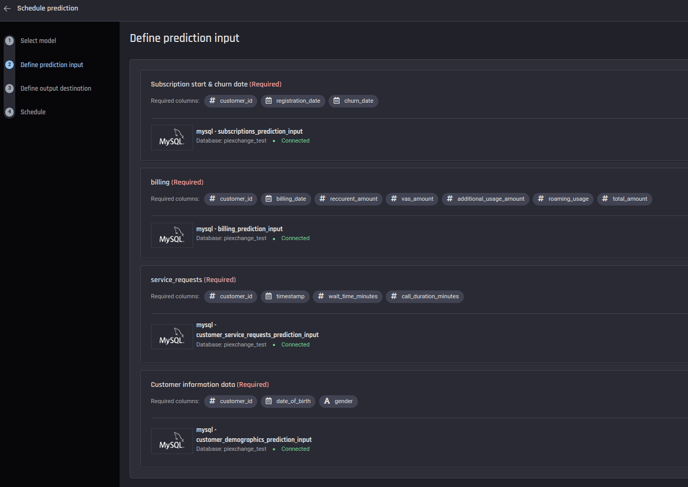
2. Define prediction input
Depending on the data availability, you can either use the data already uploaded to the Engine to make a one-off prediction for the next time period or, if you have more data at the time of prediction, you have the option to use it as well.
For this example you can continue by using the data already uploaded to the Engine.
The data uploaded spans from 01 Mar 2022 to 21 Mar 2023. Given the input, the template will predict the likelihoods of churn for the users who were active as of 21 Mar 2023.
 Define prediction input
3. Define output destination
This is an optional step to specify where to export the prediction output.
You have options to export the output either as a new table in a database, or appending to an existing table in a database or as a dataset to a project in the Engine.
Even if you didn’t specify the output destination, you can download the prediction output once it is ready.
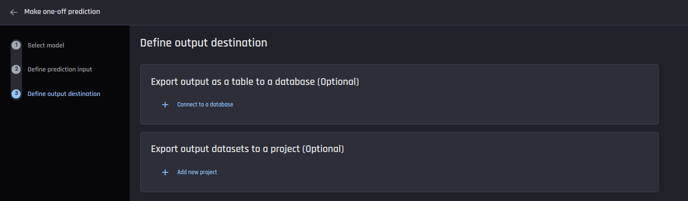 Optionally define prediction output destination
Once these steps are completed you can click Run prediction to start the prediction process which will direct you to the Prediction details page. You can see the prediction status in this prediction details page or in the App details page.
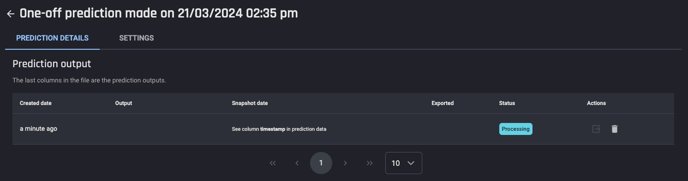 Prediction status
Once the prediction status changes to Ready, you can consume the predictions in three ways.
-
Preview a sample of the output
-
Download the output as a csv, json lines or parquet file
-
Export output to a dataset within the Engine or to an external database
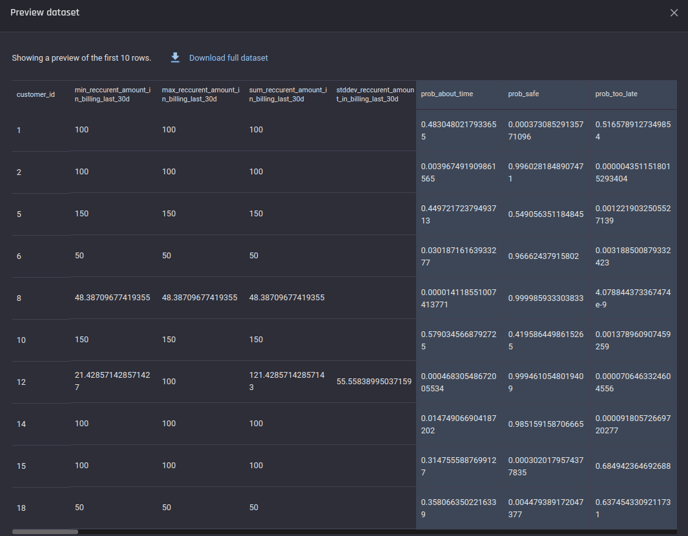 Prediction preview
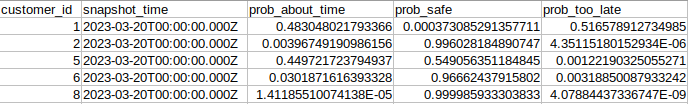 Prediction output as a csv. This file contains the features generated by the Engine as well, however those columns were hidden in this image for clarity
Schedule periodic predictions
Scheduling periodic predictions requires 4 steps to complete:
1. Select the model
Same as one-off predictions above.
2. Define the prediction input
Provide a connection to a database table/collection containing up-to-date subscription start and churn dates info, events and customer info data (If you didn't provide the customer info data while building the app, you won't be asked for it).
Provide the data connection by choosing the database server type, and enter the credentials and details of the corresponding tables.
 Providing connection to a database to get inputs for periodic predictions
3. Define the output destination
This is same as one-off predictions above.
4. Schedule
Input when and in what frequency you want to get the predictions.
For example: Schedule predictions 9 a.m. on 1st day of every month.
.png?width=688&height=189&name=periodic_prediction%20schedule%20(1).png) Define the schedule for periodic predictions
Define the schedule for periodic predictions
Once these steps are completed, you can click Run prediction to start the prediction process. In a similar manner to the one-off predictions, you can see the prediction status on the Prediction details page or the App details page. However, note that you won’t see any predictions until the scheduled time.
Once predictions are made automatically by the Engine at scheduled times, you can consume them in the same three ways as one-off predictions.
Conclusion
This article demonstrated a convenient and easy-to-use ML Solution Template using the AI & Analytics Engine. This solution specifically focused on predicting customer churn for businesses operating on a paid-subscription model.