This article explains the different metrics used to evaluate a multiclass classification model's performance and identifies the best metrics to do so.
Multiclass classification models classify each observation in a dataset into one of many categories. Evaluating these multiclass classification models for their performance, once they are trained, is crucial. The AI & Analytics Engine suggests the most suitable metric for this purpose as “Prediction Quality”. In addition, there are many other metrics available in the AI & Analytics Engine to easily compare and evaluate the trained multiclass classification models. This article introduces these multiclass classification metrics available in the Engine.
How multiclass classification metrics are calculated
Typical multiclass classification problems produce a decision score (most models produce prediction probability as the decision score) for each class. The class with the highest decision score is considered the predicted class.
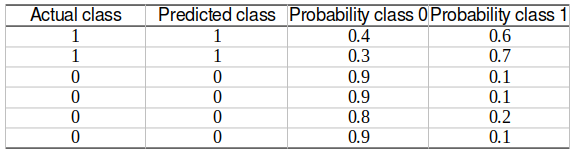
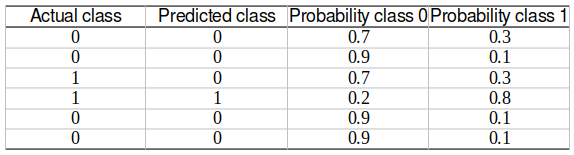
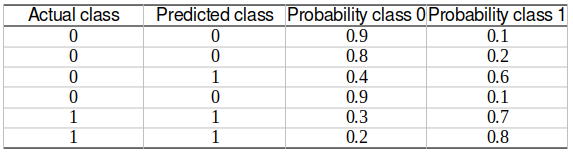
To calculate the evaluation metrics of a multiclass classification problem, it is first broken into multiple binary classification problems. This is done using the “One-vs-Rest (OVR)” strategy in the Engine. In OVR, the actual and predicted classes and the corresponding decision scores are re-calculated for each class, combining all other classes as a single class. This essentially creates a binary classification output. This is done for each class in the multiclass classification, converting the multiclass output into multiple binary classification outputs equal to the number of classes.
See the example below, where the output of a multiclass classification task with 3 classes: A, B, and C are converted to three binary classification outputs using the OVR strategy.
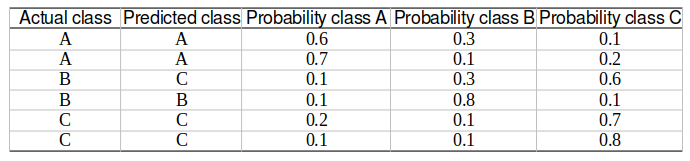 Multiclass classification model output
After forming these binary classification outputs, the binary classification metrics are calculated for each of them. The following metrics are calculated in the Engine.
Precision
This calculates the proportion of the observations, predicted by the model as positive, that are actual positives.Recall
This calculates the proportion of the actual positive observations, that are predicted correctly by the model as positive.F1 score
This takes into account both precision and recall metrics by calculating their Harmonic mean.False-positive rate
This calculates the proportion of actual negative class observations that are incorrectly predicted by the model as positive.Area under the Receiver Operating Characteristic Curve (AUC ROC)
An ROC curve is a plot of the True positive rate (similar to recall) against the False positive rate. This AUC ROC metric measures the area under this curve.
💡AUC ROC is the best measure to use in the case where the positive class is not minority. Hence, it is used as a proxy for Prediction Quality in the Model Leaderboard page.
Average Precision score (Adjusted)
This is a metric derived from measuring the area under the Precision-Recall curve and adjusted for the cases that occur where the precision might not be defined.
💡 AUC PR is the best measure to use in the case where the positive class is the minority. Hence it is used as a proxy for Prediction Quality in the Model Leaderboard page.'
🎓 For a detailed explanation of Average Precision score (Adjusted) read, the Average Precision score (adjusted) section in which metrics are used to evaluate a binary classification model's performance?
For the False-positive rate, the lower the value, the better the model’s performance. For all the other metrics, a higher value indicates better model performance. All these metrics have a range from 0 to 1.
For each metric listed above, the metric values for binary classification outputs of all classes in the multiclass classification problem are combined to calculate a multiclass classification metric. There are two such ways of combining:
-
Macro average - Calculates a simple average of the binary classification metric values of all classes.
-
Weighted average - Calculates the average of the binary classification metric value of all classes, weighted by the number of actual instances for each class (support).
💡 Typically, the macro-averaged F1 score is the most suitable measure for multiclass classification. Therefore, it is used as a proxy for Prediction Quality in the Model Leaderboard page.
In addition, the following two metrics which can be directly calculated from the multiclass output without the OVR strategy, are also calculated and displayed in the engine.
-
Log loss - calculates the negative of the average logarithm value of the actual class’ predicted probabilities.
-
Accuracy score - ratio of number of observations where the correct class is predicted to the total number of observations in the test set.
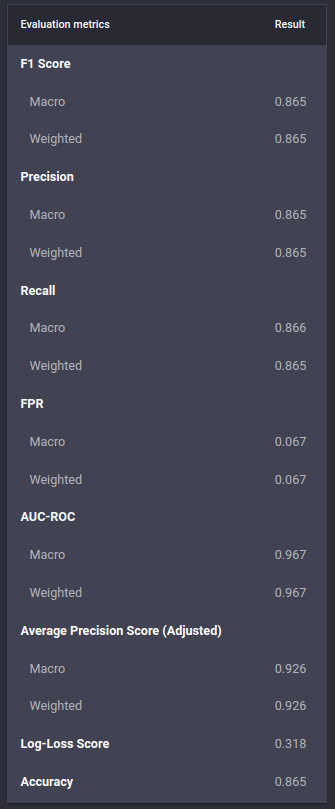 List of metrics for a multiclass classification problem in the Engine
Selecting the most suitable multiclass classification metrics
Identifying the correct metric to evaluate multiclass classification models is critical for inspecting model performance. This typically depends on the problem context which is known to the user in advance. Here are a few tips to guide this decision.
For example, unlike the binary case where precision and recall alone may not be the best option for performance evaluation, macro and weighted precision and recall scores by themselves can be good choices for multiclass classification.
The AI & Analytics engine also suggests the most suitable metric for multiclass classification as the “Prediction Quality” in the Model Leaderboard page of the supervised ML models. However, users who prefer to utilize other metrics, including log loss, accuracy score, and macro and weighted metrics have the option to view them under the Performance page for each model.
Multiclass Confusion Matrix
The confusion matrix shows the number of observations belong to each class in actual data and predictions.
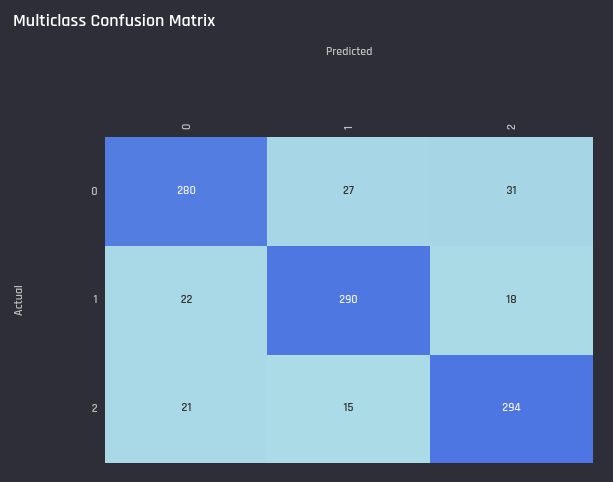 Example multiclass confusion matrix in the Engine
🎓 For a detailed explanation of Confusion Matrix, read the Confusion matrix section in which metrics are used to evaluate a binary classification model's performance?
Calculating a multiclass classification metric
For each metric listed above, the metric values for binary classification outputs of all classes in the multiclass classification problem are combined to calculate a multiclass classification metric. There are two such ways of combining:
-
Macro average - Calculates a simple average of the binary classification metric values of all classes.
-
Weighted average - Calculates the average of the binary classification metric value of all classes, weighted by the number of actual instances for each class (support).
Typically, the macro-averaged F1 score is the most suitable measure for multiclass classification. Therefore, it is used as a proxy for Prediction Quality in the Model Leaderboard page.
In addition, the following two metrics which can be directly calculated from the multiclass output without the OVR strategy, are also calculated and displayed in the engine.
-
Log loss
-
Accuracy score
Selecting the most suitable multiclass classification metrics
Identifying the correct metric to evaluate multiclass classification models is critical for inspecting model performance. This typically depends on the problem context which is known to the user in advance. Here are a few tips to guide this decision.
For example, unlike the binary case where precision and recall alone may not be the best option for performance evaluation, macro and weighted precision and recall scores by themselves can be good choices for multiclass classification.
The AI & Analytics engine also suggests the most suitable metric for multiclass classification as the Prediction Quality in the Model Leaderboard page of the supervised ML models. However, users who prefer to utilize other metrics, including log loss, accuracy score, and macro and weighted metrics have the option to view them under the “Performance” page for each model. =