This article demonstrates how to use the templated machine learning solution to predict the possibility of customer churn, for a transaction-based business.
Customer churn is a major concern for many businesses, as it directly impacts revenue and business strategy. To identify which customers are likely to churn, a comprehensive solution is required that involves complex and labor-intensive data processing steps, selecting the relevant factors that affect churn and applying the suitable machine learning algorithm.
This is not a trivial task and it varies depending on the nature of the business. The AI & Analytics Engine offers you an effective solution to this problem with the Customer Churn Prediction ML Solution Template.
You just need to enter some quantitative information about your business nature and objectives, and the entire process will be automated, enabling you to predict customer churn with speed and accuracy.
There are two options in the Customer Churn Prediction ML Solution Template:
-
Predicting whether a transactional activity will decline in volume, or frequency for each customer who is currently active
-
Predicting the likelihood of each customer terminating their ongoing paid subscription service
This article will explore the Customer Churn Prediction template for transactional businesses. This refers to businesses with customers that make transactions or individual purchases.
![]() To learn more about the Engine’s template for subscription-based businesses, read how to use the templated ML solution for the subscription option in the customer churn prediction template?
To learn more about the Engine’s template for subscription-based businesses, read how to use the templated ML solution for the subscription option in the customer churn prediction template?
Use case: Predicting customer churn for banking service
Suppose you're a bank employee who wants to utilize your customer data to initiate a successful customer retention campaign. You aim to identify customers who are likely to leave your service in the near future, so you can target them with retention efforts, resulting in significant cost savings as retaining existing customers is far cheaper than acquiring new ones.
To accomplish this, you use the Engine's transaction-based Customer Churn Prediction template to build a machine learning powered app that identifies customers that are likely to churn.
Data
The input data required for the template consists of the following datasets:
Customer transaction dataset (required)
A required dataset that records the details of customer transactions, with three key attributes that will be used:
-
Account ID (who made the transaction)
-
Date (when the customer made the transaction)
-
Amount
In this specific example, each transaction represents a record of spending, which can occur either through direct card usage or cash withdrawal.
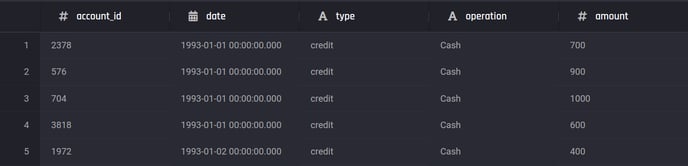 Preview of the customer transactions dataset
Customer information dataset (optional)
An optional dataset that contains customer biographic or demographic profile data, for example:
-
District ID
-
Sex
-
Date of birth
-
Etc.
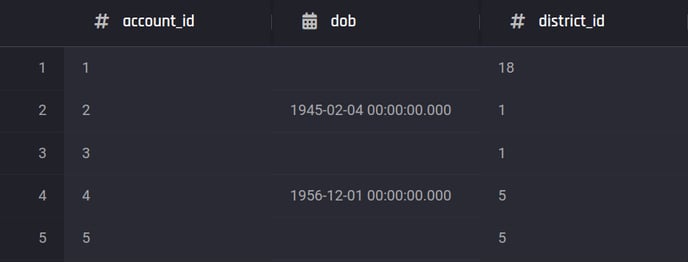 Preview of the customer information dataset
![]() The transactions and customer information data used in this article are obtained from the Czech bank dataset which is publicly available.
The transactions and customer information data used in this article are obtained from the Czech bank dataset which is publicly available.
Creating a Customer Churn Prediction app
In this section, you can follow some simple steps and provide the required information to create an application that uses machine-learning models to predict customer churn.
You’ll observe how this templated solution shortens the time between feeding raw data to getting insightful predictions.
To access the app builder, on the Project Homepage select Customer Churn under Machine Learning Solution Templates.
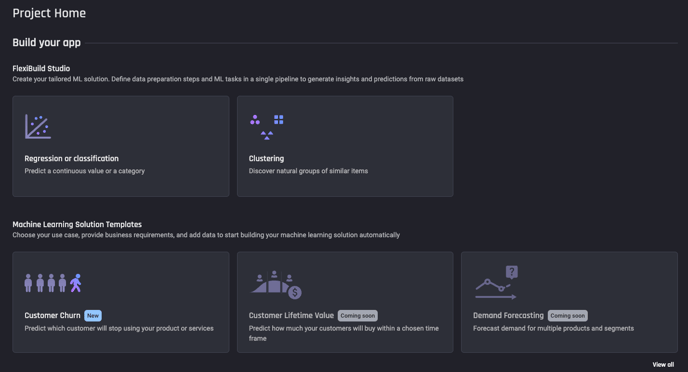 Select Customer Churn from the Project Home page
Then create the application by clicking Use this template and naming the application. This will take you to the App builder pipeline.
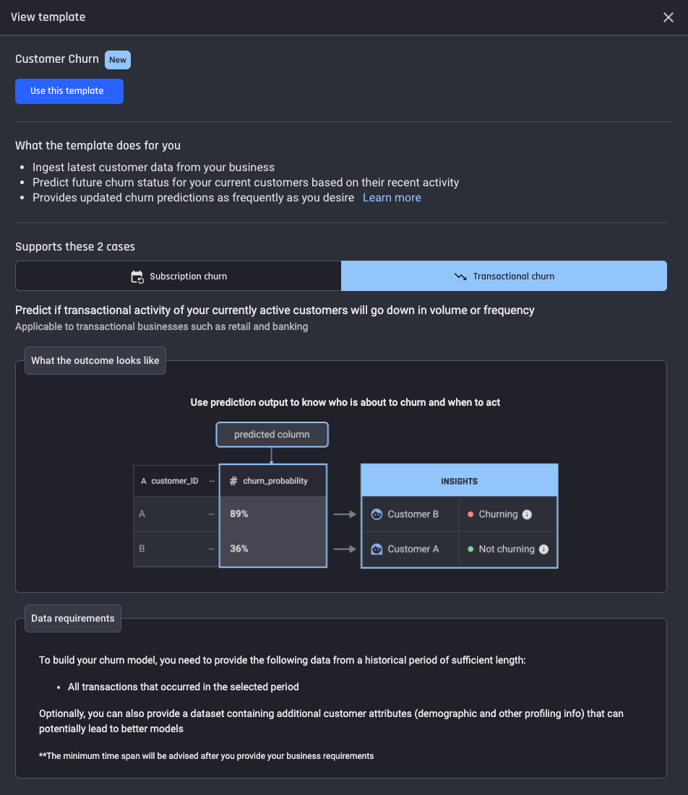 Select Use this template to create the application
Step 1: Select a template that matches your business type
Within the App builder pipeline, for transaction-based businesses, choose the option “Predict if transactional activity of my currently active customers will go down in volume or frequency ”.
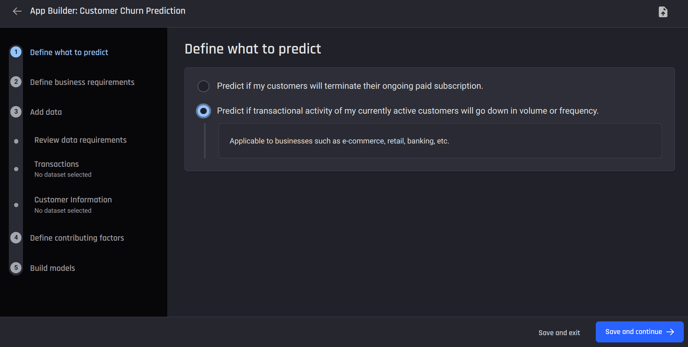 Choose the second option for transaction-based businesses
Step 2: Define business requirements
You need to define the business requirements including defining churn and the prediction frequency. This step requires an understanding of what churn means to your business.
For this example, define churn as: Predicting if a customer will churn after the next 30 days, and that your customer is considered churned if their total number of transactions in 60 days is less than 2.
Select a prediction frequency of 1 month.
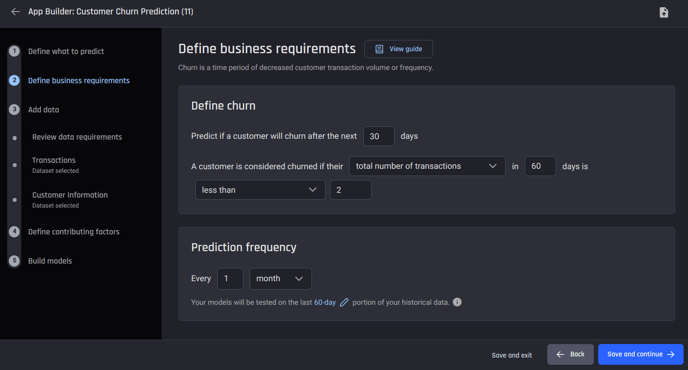 Appropriately define churn and prediction frequency based on business goals
🎓 For more information about churn definition, read what options are available to define churn within the transactional option in the customer churn prediction template?
Step 3: Import the transaction data and the optional customer-information data
Review the data requirements to build the models. Based on the parameters provided when defining the business requirements, the transaction history data required must span at least 330 days.
The data you need is:
-
Transaction data (required data)
-
Customer info (optional data)
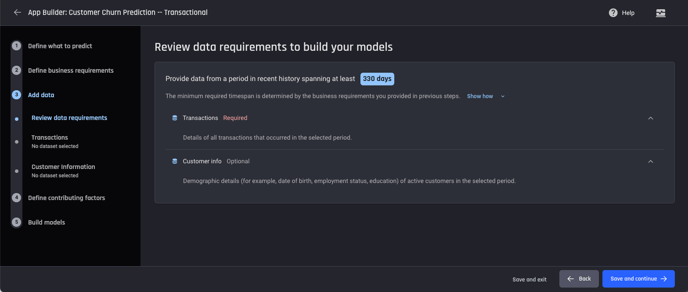 Review data requirements
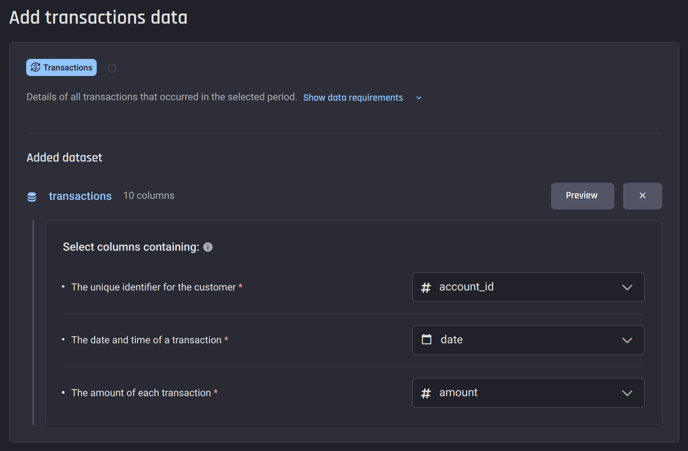 Select the appropriate columns in the transaction dataset
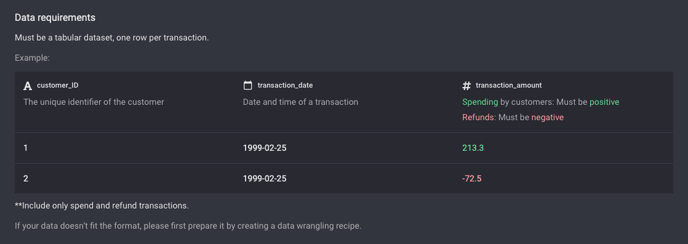 Requirements for the transaction dataset. The transactions should only be spending or refund.
 Select the identifier column in the customer-information dataset
Step 4: Determine the time frames in the past that influence the probability of churn
It is crucial to identify the time frames in which customer transaction patterns may indicate their likelihood of churn. Initially, three time frames have been pre-selected for you, as depicted in the figure below. These can be altered or supplemented with any additional time frames that meet your requirements.
Furthermore, the potential influence of demographic information should be taken into account. You can choose any demographic factors that you believe might impact the customer's probability of churn.
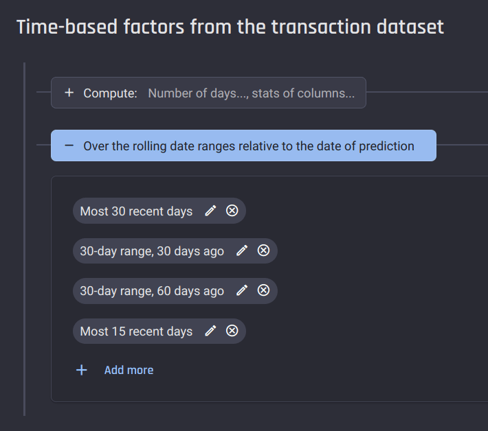 By default, three time-frames are provided. You can customize them or add more.
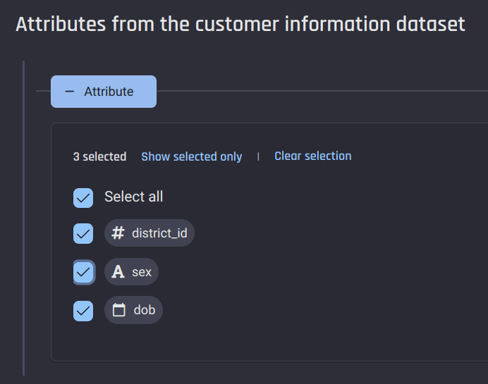 Select appropriate attributes from the customer-information dataset
![]() The Engine will calculate various statistics for the transaction amount based on the specified time frames. These statistics enable the machine-learning model to detect customer behavior patterns as they reflect in their past transactions and apply that knowledge to predict the future.
The Engine will calculate various statistics for the transaction amount based on the specified time frames. These statistics enable the machine-learning model to detect customer behavior patterns as they reflect in their past transactions and apply that knowledge to predict the future.
🎓For more information about these statistics, read what do contributing factors mean
🎓To understand how the Engine processes the data, read how does the Engine process data for the transactional customer churn prediction template.
Step 5: Configure model training
The final stage involves selecting the configuration for your model's training. You have the option to allow the Engine to automatically identify the best models according to your specified criteria, or you can choose to manually select the algorithms.
For this example select the top 3 algorithms with estimated prediction quality of at least 70%
.png?width=488&height=202&name=step%205%20example%20(updated).png) Automatically train top algorithms based on given criteria
Automatically train top algorithms based on given criteria
The app-building process will start as soon as you complete this step, and the resulting app will allow us to make predictions and explore the model insights.
You will be directed to the App summary page with the label Processing. You can see the progress of the app in each panel.
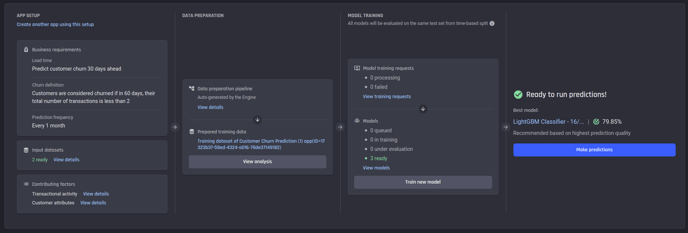 App summary once the app is ready
Analysing churn in historical data
Once the training dataset is complete, you can click View analysis under Data preparation in the App Summary page to see the charts analysing churn in historical data.
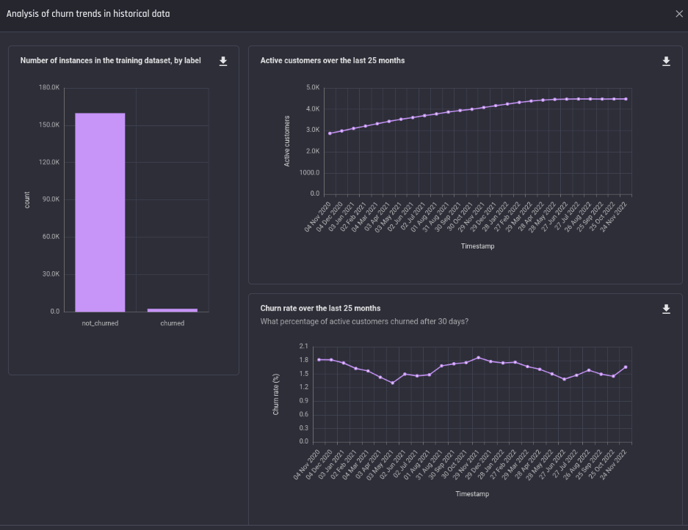 Analysis charts of historical Churn
Inspecting the model performance
Once the app building process is complete, the models begin training. When the training is complete, on the right side of the App Summary page there is a short overview of the best trained model, which shows the prediction quality of that model.
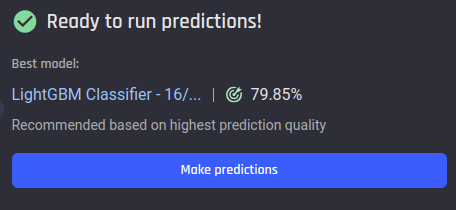 Recommended model and its prediction quality
![]() For more information about how a model is evaluated in the Customer Churn Prediction template, read how are models evaluated in ML Solution Templates
For more information about how a model is evaluated in the Customer Churn Prediction template, read how are models evaluated in ML Solution Templates
Performance
For more detailed information about the model performance, you can click on the model name, and navigate to the Insights tab, which will display the Performance page, which provides insights on the accuracy of the models predictions.
Included is multiple evaluation metrics, a confusion matrix, and charts of the ROC Curve and Precision Recall Curve.
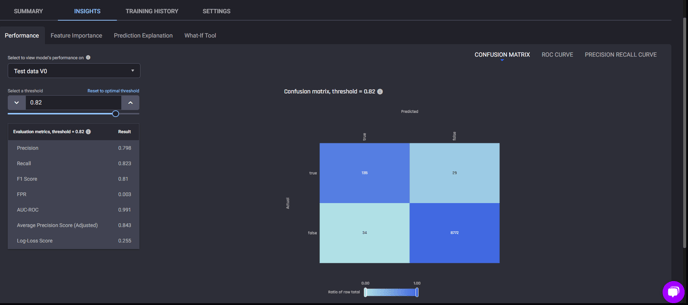 Performance page under Insights tab
🎓For more information about evaluating binary classification models, read Which metrics are used to evaluate a binary classification model's performance?
Feature Importance
The Insights tab also contains the Feature Importance page, which can provide insight into the most important behavioural predictors for customer churn, and the factors that affect the likelihood of customer churn at a given snapshot in time.
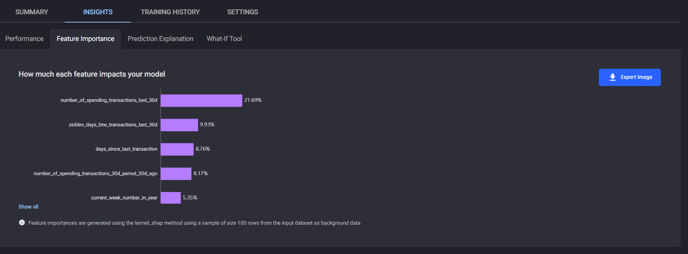 Feature importance page under Insights tab
Prediction Explanation
The next page under the Insights tab is Prediction Explanation. This feature allows you to examine the prediction of a given customer, providing what factors increase or decrease their likelihood of churning, and to what extent.
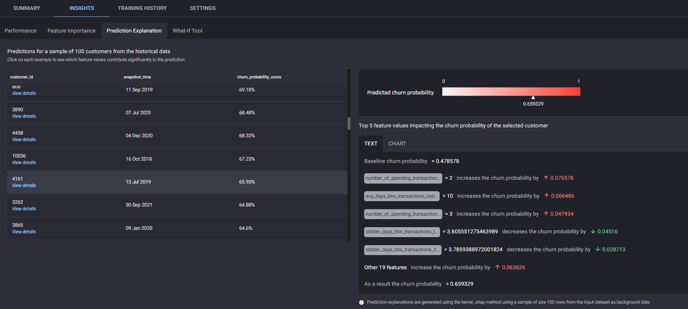 Prediction explanation page under Insights tab
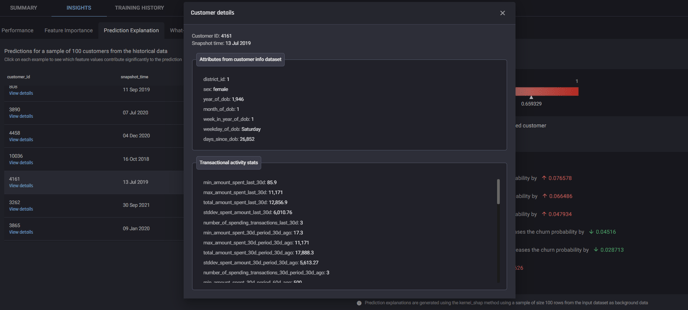 Customer details window, accessible by clicking view details for any customer in Prediction explanation.
🎓For more information about feature importance and prediction explanations, read Gain insights from predictions with Feature Importance, Prediction Explanation and What-If Analysis
Making predictions
Predictions from the Customer Churn Prediction ML Solution Template provide following:
-
A list of currently active customers.
-
The predicted probability of churn for each of them.
To initiate a prediction, click the Make prediction button on the App overview page. You have the option to select either a One-time prediction to quickly make a single prediction, or Periodically scheduled predictions, which generates predictions at regular intervals.
With both options, you’ll need to provide the same data sources you provided when creating the application. In this example, both:
- Transaction data
- Customer information
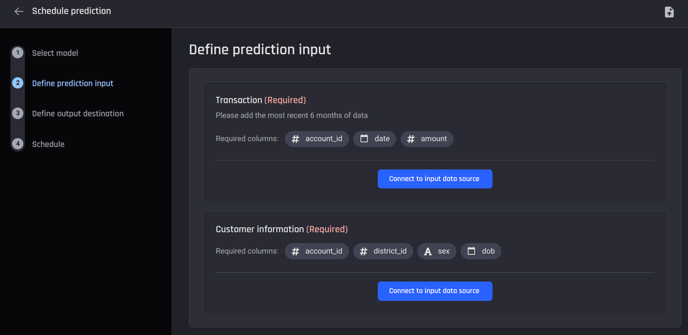 Provide the necessary inputs for prediction
For the scheduled periodic prediction option, you also need to select the frequency that the Engine will perform the prediction.
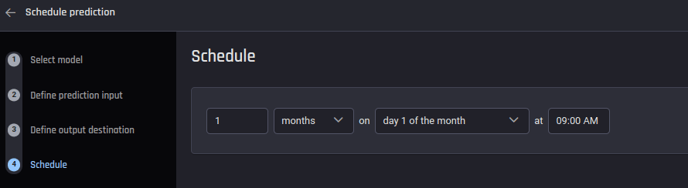 Specify the schedule in the periodic prediction option
Once these steps are completed, click Run prediction to start the prediction process which will direct you to the Prediction details page. You can see the prediction status in this prediction details page or in the App details page.
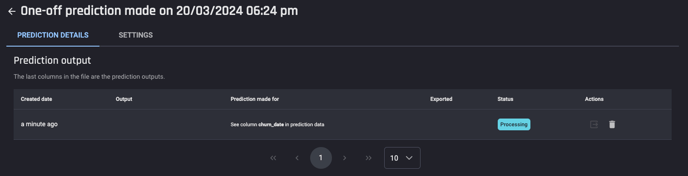 Processing Status on the App details page
Once the prediction status changes to Ready, you can consume the predictions in three ways.
-
Preview a sample of the output
-
Download the output as a csv, json lines or parquet file
-
Export output to a dataset within the Engine or to an external database
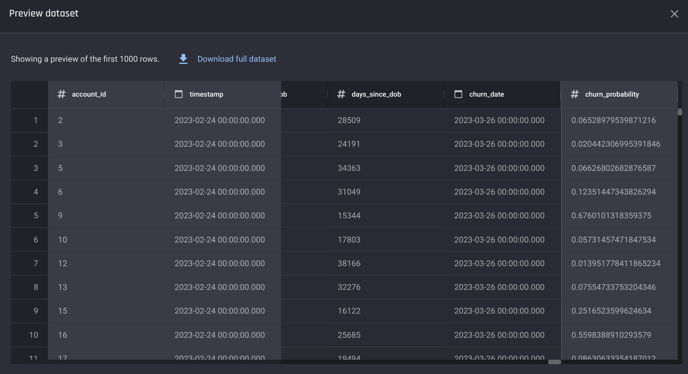 A preview of the predicted churn probability for each account ID
![]() To learn more about the supported options for prediction, read What are the options for predictions for Machine Learning Solution Templates?
To learn more about the supported options for prediction, read What are the options for predictions for Machine Learning Solution Templates?
Conclusion
In this article, a walkthrough is provided on how the AI & Analytics Engine can assist you in predicting customer churn for a transactional business with an efficient and effective solution. To create a customer churn prediction model, you only need to upload your raw datasets and define a few configuration features, which was illustrated using a banking scenario. This enables you to understand your customers' behaviors and develop the appropriate retention strategies to prevent them from churning.