Prediction quality is a metric appearing in the “Summary” and “Performance” pages of supervised ML models (Regression, Binary Classification, and Multi-class Classification) on the AI & Analytics Engine.
Prediction quality is a metric that appears in the “Summary” and “Performance” pages of supervised ML models (Regression, Binary Classification, and Multi-class Classification) on the AI & Analytics Engine.
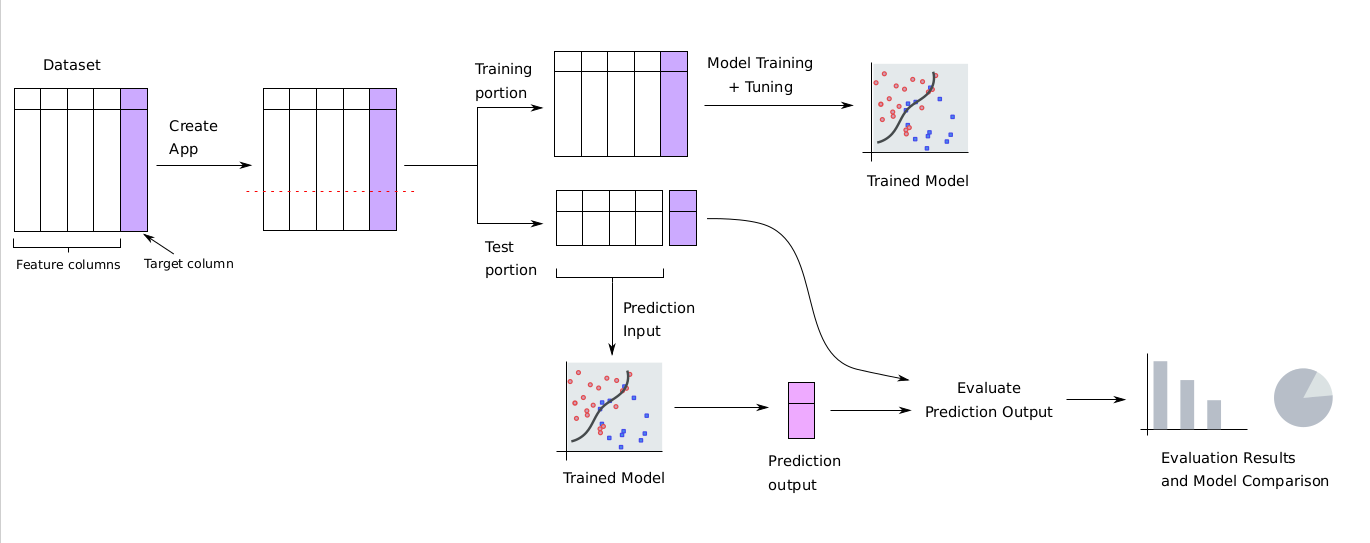
To understand what prediction quality is and how it is computed, it is first essential to know how models are evaluated. The dataset chosen by the user to create the supervised ML app is first split into separate train and test portions. Each model under the app is trained using only the train portion, to ensure that models do not “see” the test portion during training. The trained model will be evaluated on the test portion. During the evaluation, the target column is first removed from the test portion, and the remaining columns are fed as inputs for the model to make predictions.
This way, the outcomes in the test portion that the model is required to predict are “hidden” from the model. The predictions of the model on the test portion are then compared with the actual values in the target column which the model should have ideally predicted. This process is summarized in the diagram below:
Prediction quality is one of the metrics that are computed in the above evaluation process. It is a measure of how close the supervised ML model’s predictions are to the actual values in the target column of the test/evaluation portion in question. It is a percentage value from 0% to 100%, where 0% indicates that the model’s predictions are completely off, and 100% indicates that the model predicts perfectly.
Even though the term Prediction Quality is used for all three problem types (Regression, Binary Classification, and Multi-class Classification), it is computed using a different underlying metric in each case.
Regression
For regression, the prediction quality is measured by the R2 score, also known as the “coefficient of determination” in the statistical community.
The range for the R2 score is 0 to 1, with 0 being the worst and 1 being the best. This score is multiplied by 100 to get a percentage value as the “Prediction Quality”.
Note: The usual method of computing the R2 score can result in a negative value if the model is really bad. In such cases the engine automatically clamps it to a value of 0. Hence, a value of “0” is to be understood as “R2 score of 0 or negative”.
To learn more about the R2 score and the other regression metrics, see this article on regression evaluation metrics.
Binary Classification
Binary classification presents two cases, depending on whether the positive class is minority or not in the test/evaluation dataset:
-
When the positive class is minority: Prediction quality is measured by the Adjusted Average Precision score. This metric is a scaled version of the area under the defined* points of the precision vs. recall curve. The range for this metric is 0 to 1, with higher values indicating that the model is better. The value of this metric is multiplied by 100 to get a percentage value as the “Prediction Quality”.
-
When the positive class is not minority: Prediction quality is measured by the AUC ROC (area under the ROC curve) metric. The range for this metric is 0.5 to 1, with higher values indicating that the model is better. The value of this metric is multiplied by 100 to get a percentage value as the “Prediction Quality”.
The positive class is minority when the number of rows with positive label in the target column is less than 50% of the total number of rows.
To learn more about the ROC curve, the precision-recall (PR) curve, area under curve (AUC) metrics, and other binary classification metrics, see this article on binary classification evaluation metrics.
Multi-class Classification
For multi-class classification, the prediction quality is measured by the macro-averaged F1 score metric. The range for this metric is 0 to 1, with higher values indicating that the model is better. The value of this metric is multiplied by 100 to get a percentage value as the “Prediction Quality”.
To learn more about the macro-averaged F1 score and other multi-class evaluation metrics, see this article on multi-class evaluation metrics.
*Sometimes, for high decision thresholds, the precision may not be defined. Hence, there may not be any points on the curve with recall value very close to zero.