This article is an end-to-end walkthrough of FlexiBuild Studio to build a clustering pipeline to group items in your data, using a telco use case as an example.
What is clustering?
Clustering is a machine-learning technique that finds groups of similar items within a population. A clustering pipeline typically includes the following steps:
-
Ingesting available datasets and transforming them into a single dataset of items to be clustered (clustering-ready dataset).
-
Running the clustering algorithm on the prepared dataset.
-
Analyzing the results produced by the clustering process.
🎓To learn more about clustering read What is clustering?
What does a clustering pipeline provide as the outcome?
-
An output dataset that contains the ID of the assigned cluster for each item, together with membership strength, outlier scores, membership probabilities, or membership scores (based on the algorithm selected for clustering).
-
Result analysis and insights include the following:
-
2D visualization of clustered data, indicating how well distinct groups are identified.
-
Heatmap of important features across clusters.
-
Detailed description for each cluster.
-
🎓To learn more, about understanding cluster outputs read How to analyze clustering outputs.
The clustering use case
Suppose you are working on customer retention for a telecommunication company. You are tasked with identifying different groups of customers so that you may target each customer segment with a customized message in an effort to improve retention.
In this use case, groups are defined by their customer service experience.
The data
The dataset available contains a history of customer service calls initiated by your customers over a period of time. Each record represents a service request made by a customer over the phone at some point in time. The dataset includes the following columns:
-
Customer ID – the unique identifier for each customer
-
Timestamp – the date and time when a call is made
-
Call type – the type of a service request such as “general inquiry“ and “technical support“
-
Call outcome – the outcome of a call such as “call dropped“ and “problem solved“
-
Waiting time in minutes – the time from when a call is made to when it is answered
-
Call duration in minutes – the duration of a call
📂Why not download the dataset used in this guide (telco_customer_service_requests.parquet) and generate your own clustering results?
%20(1).png?width=688&height=377&name=Product%20Documentation%20Screenshots%202023%20(2)%20(1).png) Preview of the dataset – customer service requests, visible is a single customer (id 568) with multiple service records
Preview of the dataset – customer service requests, visible is a single customer (id 568) with multiple service records
Each customer typically makes multiple service requests for different reasons over this period. For example, a customer with ID 568 made three service calls (in rows 2, 5, and 12).
From the initial dataset above, the goal is to create an ML-ready dataset of customers, where each record contains all information about one particular customer and their experience in the last 90 days.
💡Preparation of an ML-ready dataset for clustering occurs at step 1: Prepare data of the clustering app builder pipeline which is referred to as a clustering-ready dataset in this guide. In real-world scenarios, data more often than not, needs to go through a data-wrangling process to get it machine-learning-ready.
Building a clustering app using the AI & Analytics Engine
To create a new clustering app, select the Clustering problem type under FlexiBuild Studio on the Project Homepage.
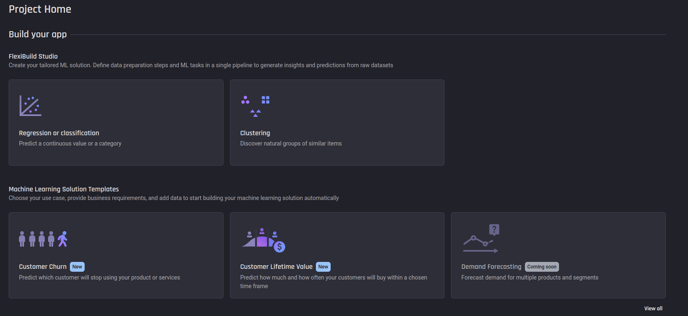 Selecting Clustering from the ML problem types
💡FlexiBuild Studio is the flexible ML pipeline builder for greater customization on your ML pipeline.
After selecting Clustering you will start the clustering App Builder Pipeline. There are three main steps within it:
- Prepare data
- Select features
- Configure clustering algorithms to run
Step 1: Prepare data
This use case requires data preparation to transform the original dataset into a clustering-ready dataset.
Add dataset and prepare data
To get started first add the dataset of customer-service requests. Once the dataset is added, select Prepare data.
💡For your own use case, if no data preparation is required (the data you uploaded was already an ML-ready dataset), step 2 can be commenced by selecting Use as a clustering input. Please note most ML results are greatly improved by proper data preparation first.
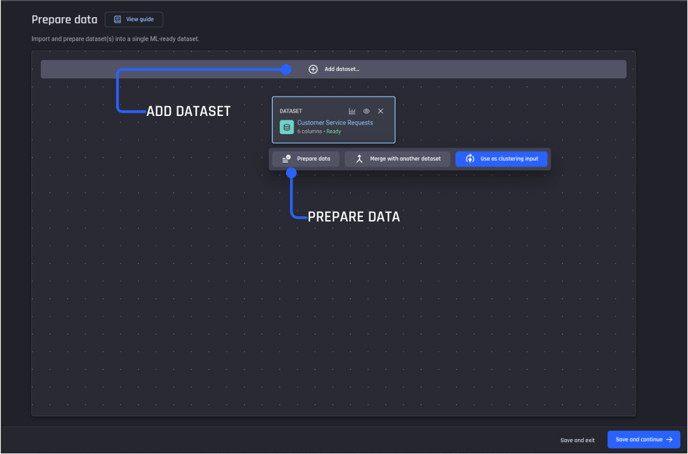 Step 1, data preparation pipeline. Add dataset then prepare data
Create a data preparation recipe
Create a new data-wrangling recipe to prepare your dataset. A recipe is a reusable collection of data transformation actions to get your data ML-ready.
💡This use case requires you to use your domain knowledge (of customer service in telco), to create additional features, from the existing dataset features that characterize the customer experience.
You decide on the following additional data features:
-
Average call waiting time in minutes
-
Average call duration in minutes
-
Number of calls
-
Most frequent call type
-
Most frequent call outcome
-
Most frequent day of the week when the service request was made
-
Most frequent hour of the day when the service request was made
-
Number of days since the last service request was made
To create these additional features, you need to add the required actions one by one to your recipe, while checking the preview pane to see how the transformation actions look when applied.
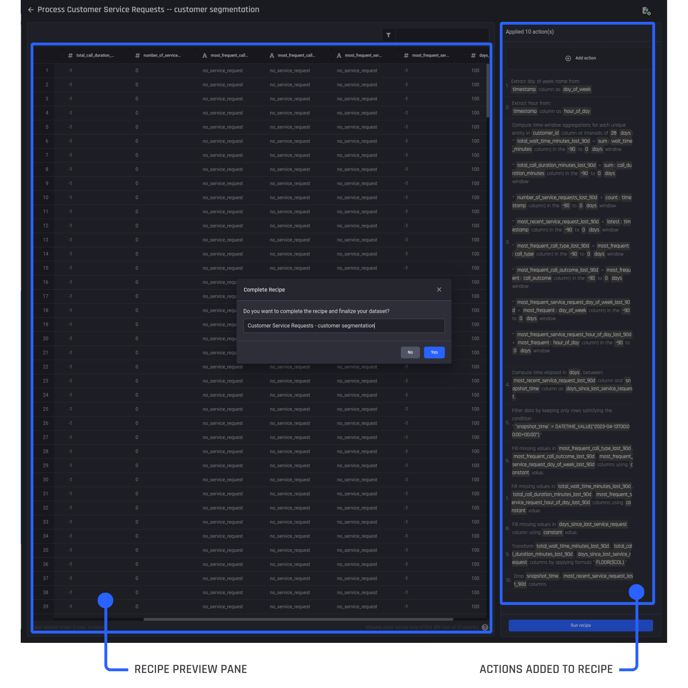 The recipe builder, with actions added on the right and a preview pane visible to the left so you can review actions performed against the dataset
You can see that additional feature columns have been created by the transformation actions.
Once you are satisfied with the recipe by checking the preview pane, select Run recipe to create the output dataset. You name it “Customer Service Requests – customer segmentation“. This is your clustering-ready dataset.
🎓Learn more about using actions within a recipe to prepare your data and engineer additional features.
Step 2: Select features
In the second step, select the prepared dataset to Use as clustering input and proceed to feature selection.
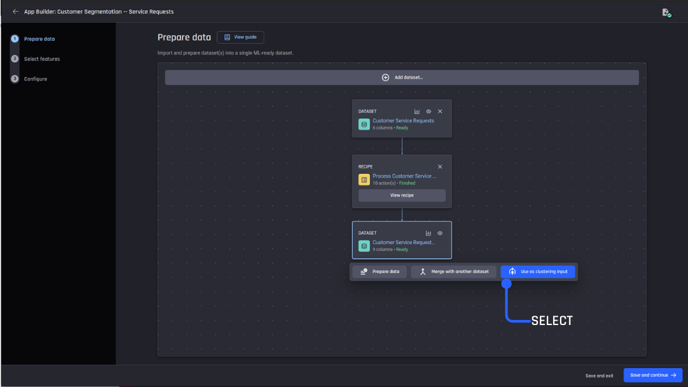 Select the prepared dataset (clustering-ready dataset) as the clustering input
On the feature selection page, you can specify the type of a feature as either categorical or numeric. The choice of the appropriate feature type is crucial to the interpretability of clustering results.
The Engine leverages the power of Generative AI to infer and recommend the most appropriate feature type. You can proceed with or without modifications.
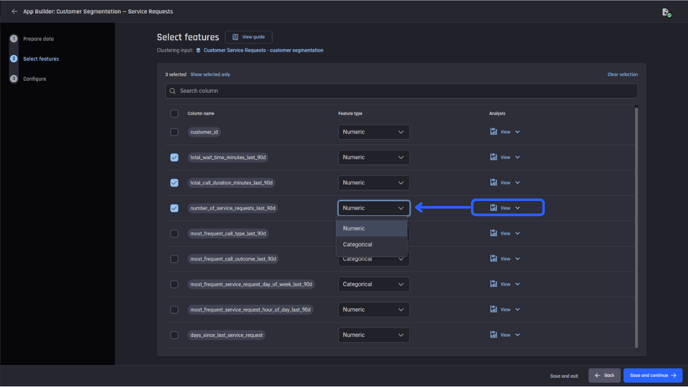 Feature selection page where you can select the features to include in your model and confirm the feature type
You can inspect each feature using the Analysis link. It provides a histogram visualization if the feature type is numeric and a bar chart of value counts if the feature type is categorical. Statistical attributes such as count and percentage of missing values are also shown.
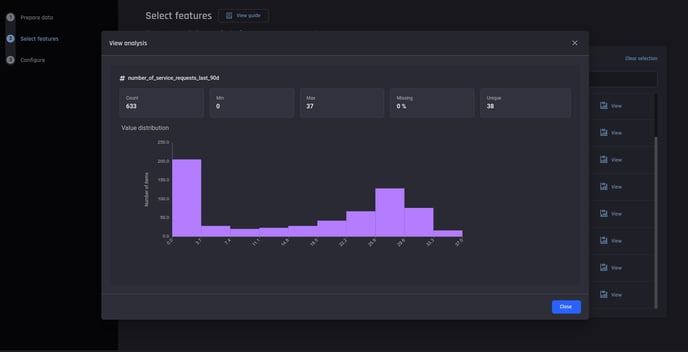 Viewing the statistical summary and visualization of each feature
When satisfied that the features are correct and assigned the correct feature type, click Save and continue to begin the last app builder step.
Step 3: Configure clustering algorithms
After the input features are confirmed, continue forward by selecting your clustering algorithms. Here, you use two algorithms – HDBSCAN on a UMAP dimensionality-reduced dataset and K-Means with the default configuration in the Engine.
Select Start building to continue to build your app and generate clustering results.
Getting your clustering results
After the app building starts, you arrive on the app summary page, this page shows how the input dataset is generated, what features were selected, and subsequently, the result for each algorithm selected in the previous step.
To obtain insights about the segments discovered by a clustering algorithm, select View details to navigate to the details on the result page.
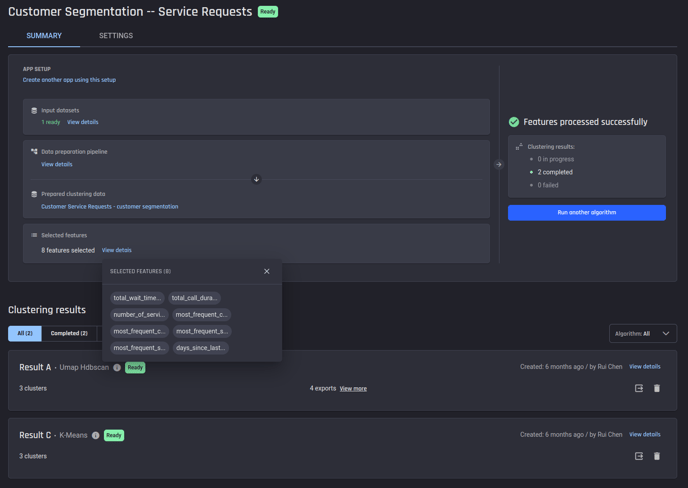 Summary of a clustering app, to view clustering results for a specific algorithm, select view details
Interpreting your clustering results
Looking at the results page of Result A generated by HDBSCAN, you can see that there are three distinct clusters as well as the associated cluster sizes – about 67% of customers belong to Cluster 1, which is to the right of Cluster 3 with over 15% of customers. On the leftmost is Cluster 2, which accounts for more than 17% of customers.
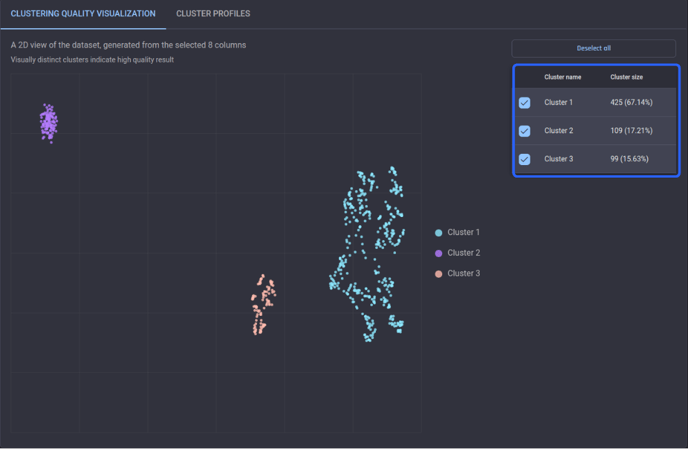 Clustering quality visualization for Result A
Moving on with the detailed description for each cluster, it is evident that the customers in Cluster 1, the largest segment, are less satisfied since the most frequent outcome of their service calls over the last 90 days does not appear to be resolved.
As seen in the description below, their call outcome does not belong to a positive category such as “problem solved“ or “information provided“.
 Description of Cluster 1 in Result A
In contrast, the customers in Cluster 2 are very satisfied with the service, with no calls from them made recently.
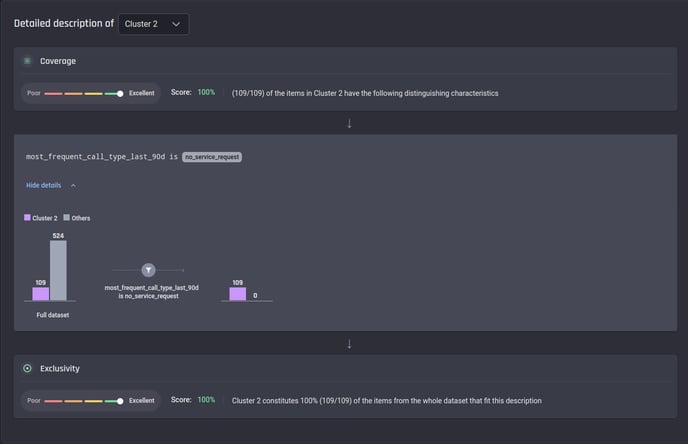 Description of Cluster 2 in Result A
Lastly, those in Cluster 3 can be regarded as satisfied since they have only a small number of service requests (less than 7), and their issues have been resolved.
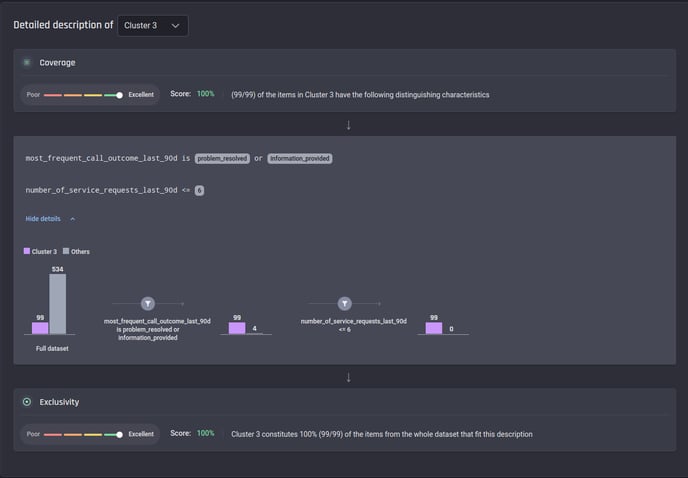 Description of Cluster 3 in Result A
Consuming clustering results
Once satisfied with the clustering result, you can either:
-
Download the results in tabular format or;
-
Export the results in tabular format into a project in the Engine or to a connected database.
🎓To learn more about exporting results read, how to export clustering results in the Engine article.
You can find the exported result from the list of datasets within your project.
After selecting the Clustering results, view the Preview tab of the results dataset. There are three additional columns – outlier score, membership strength, and cluster ID added to the prepared dataset used for the clustering input.
Using the last column – cluster ID, you can map each customer to one of the following three levels of satisfaction with the telecommunication service. This information could equip you, a retention specialist with information on who to reach out to with proactive retention tactics.
-
Cluster 2 – very satisfied
-
Cluster 3 – satisfied
-
Cluster 1 – less satisfied
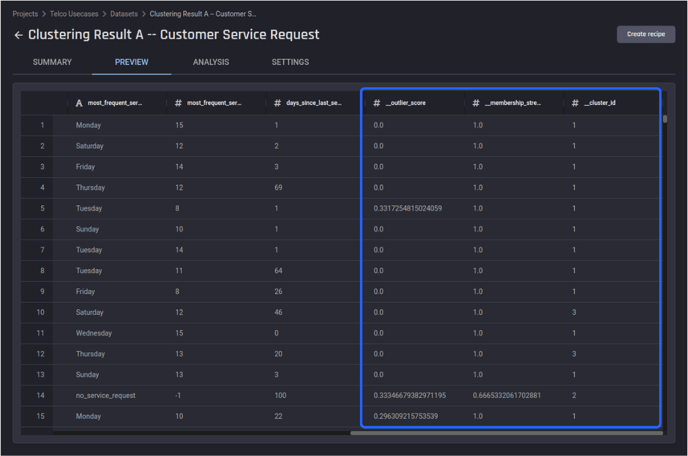 The preview of the exported results dataset for Clustering Result A
In this article, the Engine’s clustering capability was demonstrated to assist in segmenting telecommunications customers using their behavioral service data. The output information provides insight to assist proactive retention efforts to improve the business.
No coding was required at any stage of the process, including preparing data and generating clustering results. This makes it easier to focus domain knowledge on results analysis and implementation (rather than on generating the clustering pipeline).