This article explains how to evaluate machine learning model performance, and what metrics and plots are available in the AI & Analytics Engine.
What is model evaluation?
Model evaluation is the process of using metrics and plots to quantify and visualize the performance of a machine learning model. The evaluation metrics and plots are typically derived by analyzing the trained model’s predicted output of the target value when using the test portion features as the prediction input, against the test portion’s actual target value.
This process requires the data to be split in two before training the model (train/test split). The training portion is used to train the model, and the test portion is kept out for testing. The AI & Analytics Engine automatically creates the train/test split and evaluation metrics and plots. The train/test split can be configured during the app creation phase.
For more information on train/test split, see: What is the train/test split for classification and regression apps?
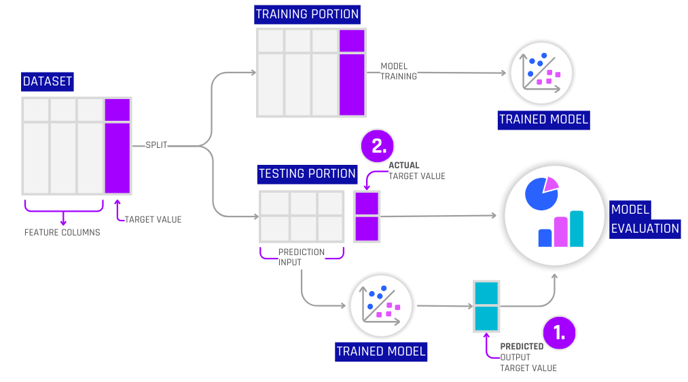 Diagram illustrating the train/test split and the relationship between the predicted target column and the actual target column as input to the model evaluation
Model evaluation metrics and plots are useful to indicate how well the model makes predictions. When used as part of the ML development process, they can guide model optimization and help anticipate real-world model performance, ensuring alignment with business objectives.
Evaluating machine learning model performance in the Engine
Within the Engine, model evaluation metrics and plots are automatically generated after a model has been trained.
Basic model performance evaluation
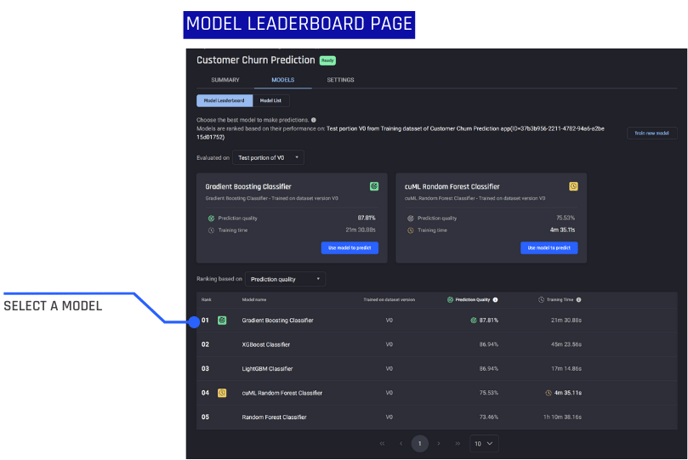
Basic evaluation metrics are quickly accessible from the Model Leaderboard page. These include prediction quality and training time. Each model will show a prediction quality, ranging from 0% to 100%.
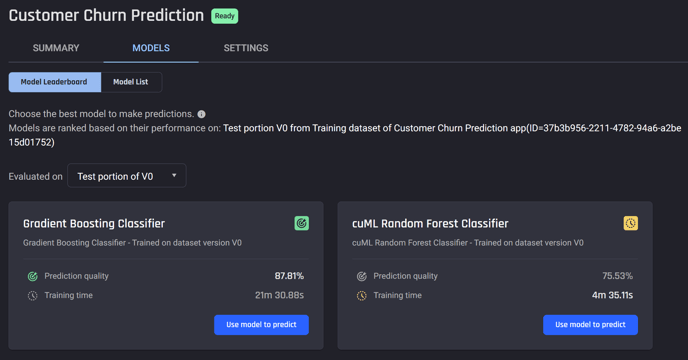
Prediction quality is calculated differently for different machine learning problem types such as regression, binary classification, and multi-class classification.
For more information on prediction quality see: What is Prediction Quality and how is it calculated for the different ML problem types?
Advanced model performance evaluation
The Engine has several advanced evaluation metrics and plots. What is displayed depends on whether the ML problem type is a regression, binary, or multi-class classification problem.
To access advanced metrics and plots navigate to the Model Leaderboard page, and select a model.
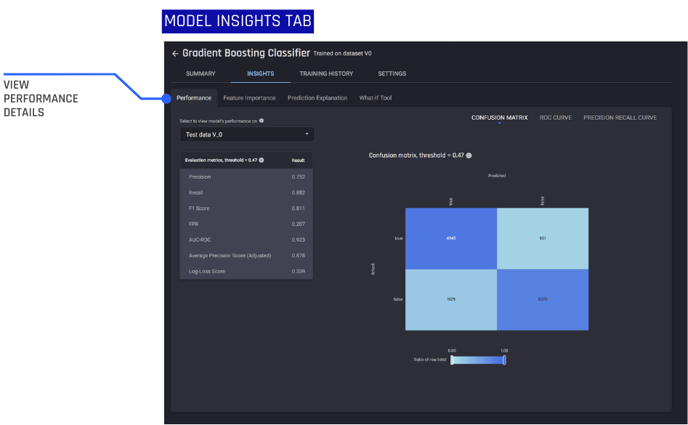
From the model “Insights” tab, the “Performance” tab contains advanced evaluation metrics and plots. In this view, a full list of evaluation metrics and relevant plots related to the problem type are displayed.
What metrics and plots are available for regression
Basic metrics
-
Prediction quality
-
Prediction Error
-
Percentage Error
Additional metrics
-
R2 Score
-
Explained Variance
-
RMSE (Root Mean Squared Error)
-
MABE (Mean Absolute Error)
-
MedABE (Median Absolute Error)
-
MAPE (Mean Absolute Percentage Error)
-
MSLE (Mean Squared Logarithmic Error)
For a detailed overview of regression metrics and their meaning see: Which metrics are used to evaluate a regression model's performance?
Plots
-
Predicted vs. actual values
-
Residuals vs. predicted values
-
Residuals distribution
What metrics and plots are available for binary classification?
Metrics
-
Precision
-
Recall
-
F1 Score
-
FPR (False Positive Rate)
-
AUC-ROC (Area Under Curve - Receiver Operating Characteristic)
For a detailed overview of binary classification metrics and their meaning see: Which metrics are used to evaluate a binary classification model's performance?
- Precision recall curve
- ROC curve
- Confusion Matrix
What metrics and plots are available for multi-class classification
Metrics
-
Macro and weighted average of
-
F1 Score
-
Precision
-
Recall
-
FPR (False Positive Rate)
-
AUC-ROC (Area Under Curve - Receiver Operating Characteristic)
-
Average Precision Score
-
-
Log-loss Score
-
Accuracy
For detailed overview of multi-class classification metrics and their meaning see: Which metrics are used to evaluate a multiclass classification model's performance?
Plots
-
Multi-class confusion matrix