Clustering

Clustering Pokémon in 15 minutes using the AI & Analytics Engine


Introduction

Finding naturally occurring groups of similar items in a dataset is a common problem in many domains. For example, in the medical field, it is applied to discover tumor groups from gene-expression data, or, in the retail field, it is used for customer segmentation among other uses. This problem can be solved with Machine Learning. However, unlike predictive Machine Learning, there are no labels associated with each item or data point to leverage on.

For example, assume we have a database of customers for a retail store, containing information about their purchase behavior. The information could be:

  • The products that each customer purchases.

  • How often does a customer purchase. (Weekly? Monthly? etc.).

  • The average spending per some time period.

  • etc.

We would like to segment the customers into groups that are “similar” in some sense and then apply a specific marketing campaign for each group, because this should be more effective than a generic marketing campaign.

The application of the clustering process includes many hurdles: Which clustering algorithm to use? How many clusters does my data have? How can I run it efficiently over large datasets? How do I understand the generated clusters? How do I visualize the results? etc.

Even technical knowledge such as relevant coding skills might not help you overcome these hurdles.

The AI & Analytics Engine overcomes these exact problems for users, making clustering easy for all. It is facilitated by internal apps that can solve many problem types. On the Engine, users can simply upload their data and choose ‘clustering’ during app creation, and specify which columns are relevant. The Engine will automatically generate results under a clustering app. It also comes with an auto analysis of the clustering results enhancing explainability, in addition to robustness and ease of use, so that the user can go from data to insights within minutes.

Finding natural groupings of Pokémon

To demonstrate the clustering process on the engine let us use the Pokémon stats dataset from Kaggle. We use this data because it is simple and ideally suited to demonstrate the key aspects of the Engine’s clustering function.

For those who aren’t familiar: Pokémon (an abbreviation for Pocket Monsters in Japanese) is a Japanese media franchise managed by The Pokémon Company, a company founded by Nintendo, Game Freak, and Creatures. There are hundred of Pokémon creatures, each with their own attributes.

Pokemon imagePikachu - a well known Pokémon (Credit: here)

The dataset contains a list of 800 Pokémon creatures and their attributes. We would like to “discover” groups of Pokémon using their attributes. Traditionally, in order to gain insights into the data, users will need to apply statistical analysis tools over the dataset manually to find “groups”, and in general, spend much time analyzing the results.

The following are the attributes of the dataset:

Dataset's attributes table

Initial insight

Before diving into the solution, we usually attempt to understand the data better. The first step is uploading the data and observing the analysis:Sample of the initial Pokémon dataset analysis                                      
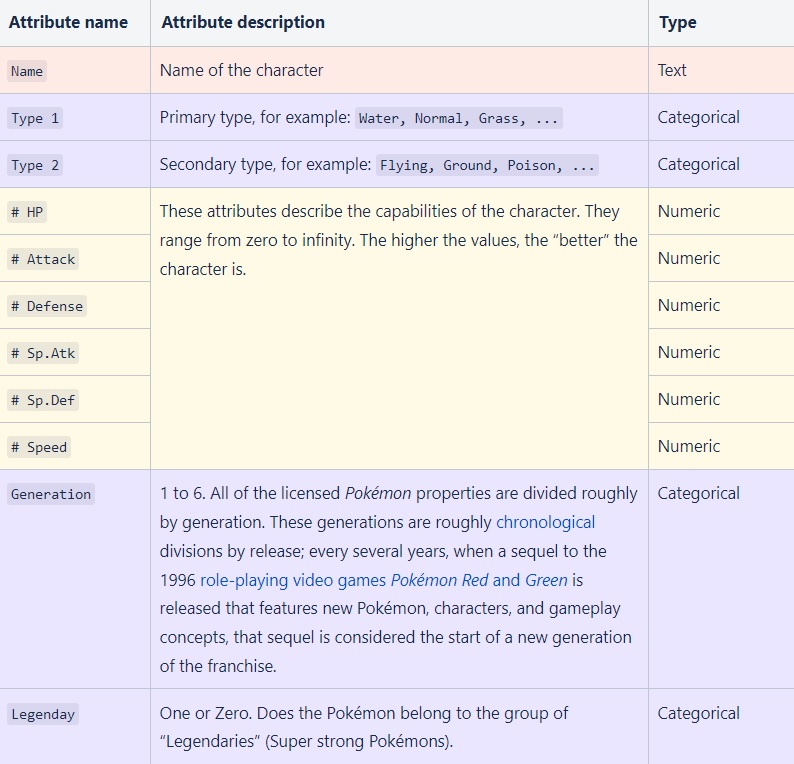
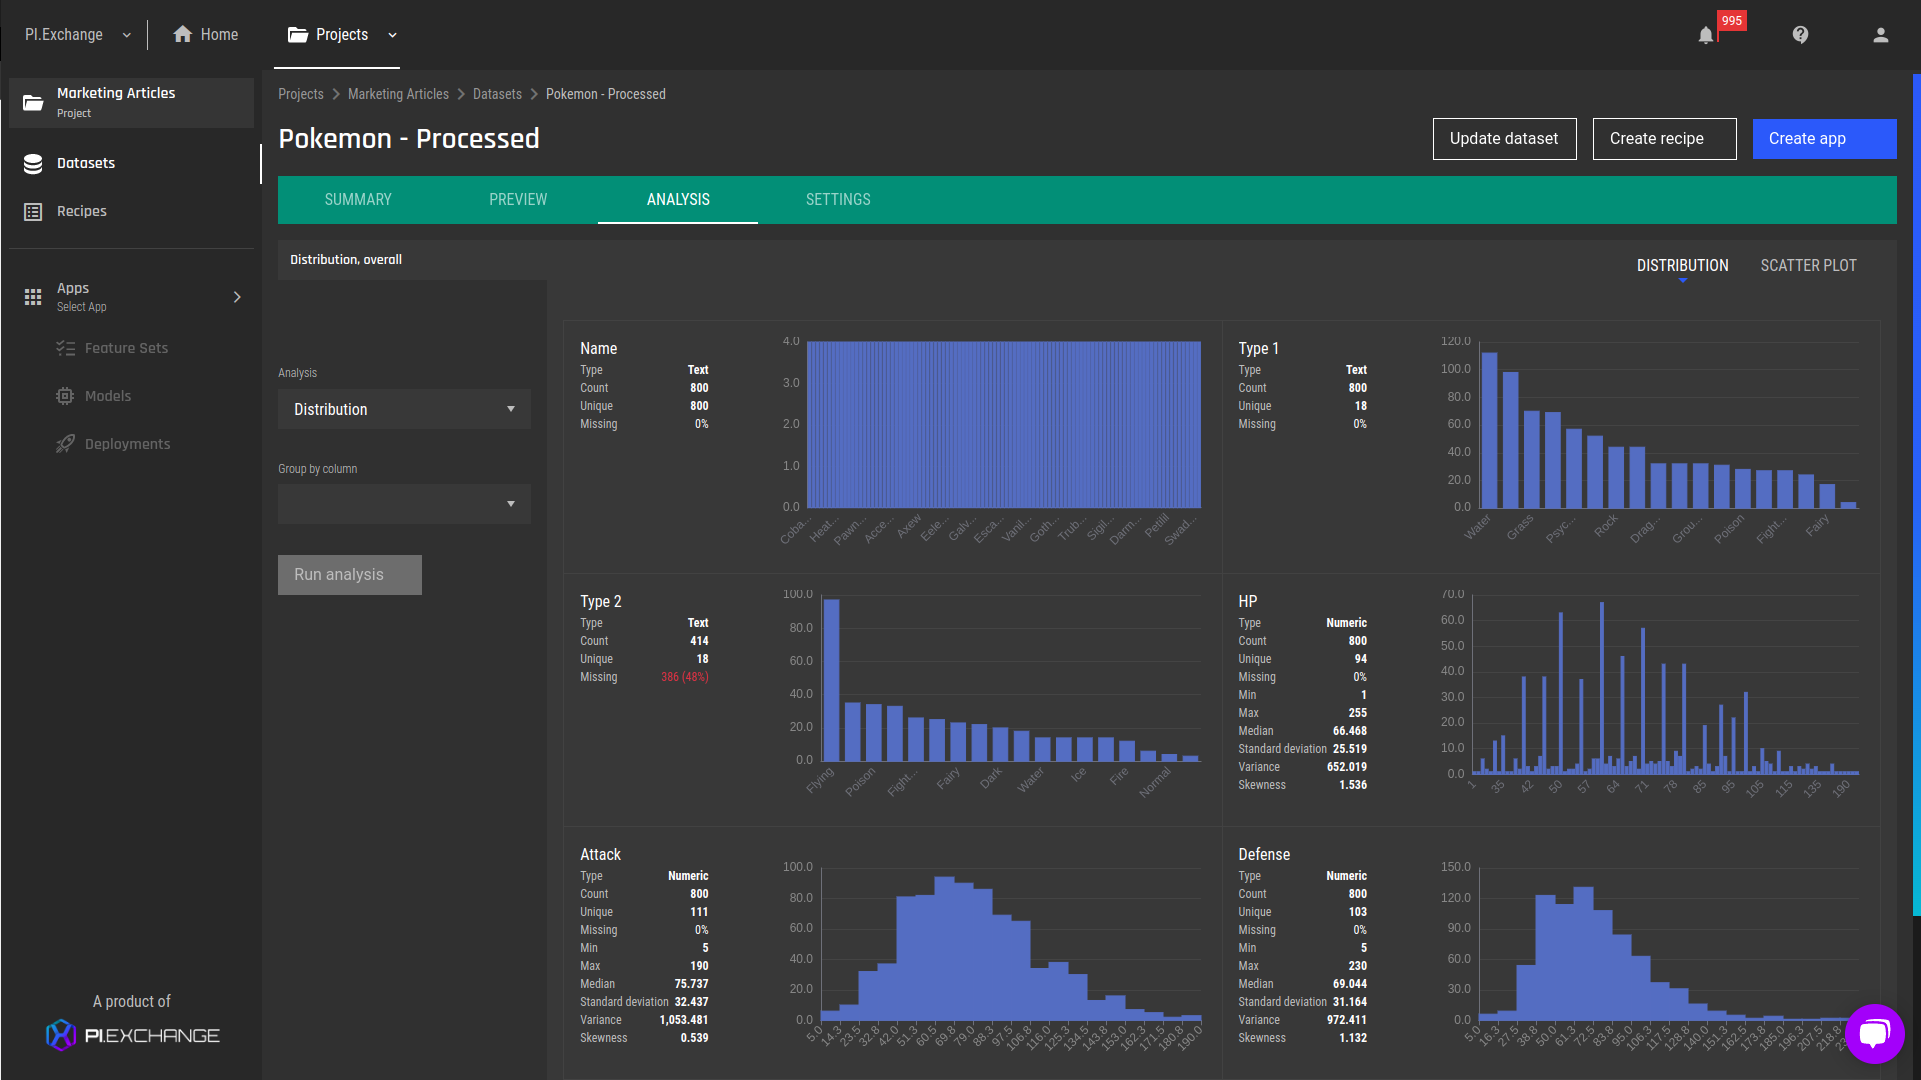
Fig 1 - Sample of the initial Pokémon dataset analysis

Using the plot we get a sense of the distribution of the features. Using the analysis we can group by specific features and get a qualitative appreciation of the differences between the groups.

Example: group by the "generation" feature:

Features analysis grouped by the generation feature
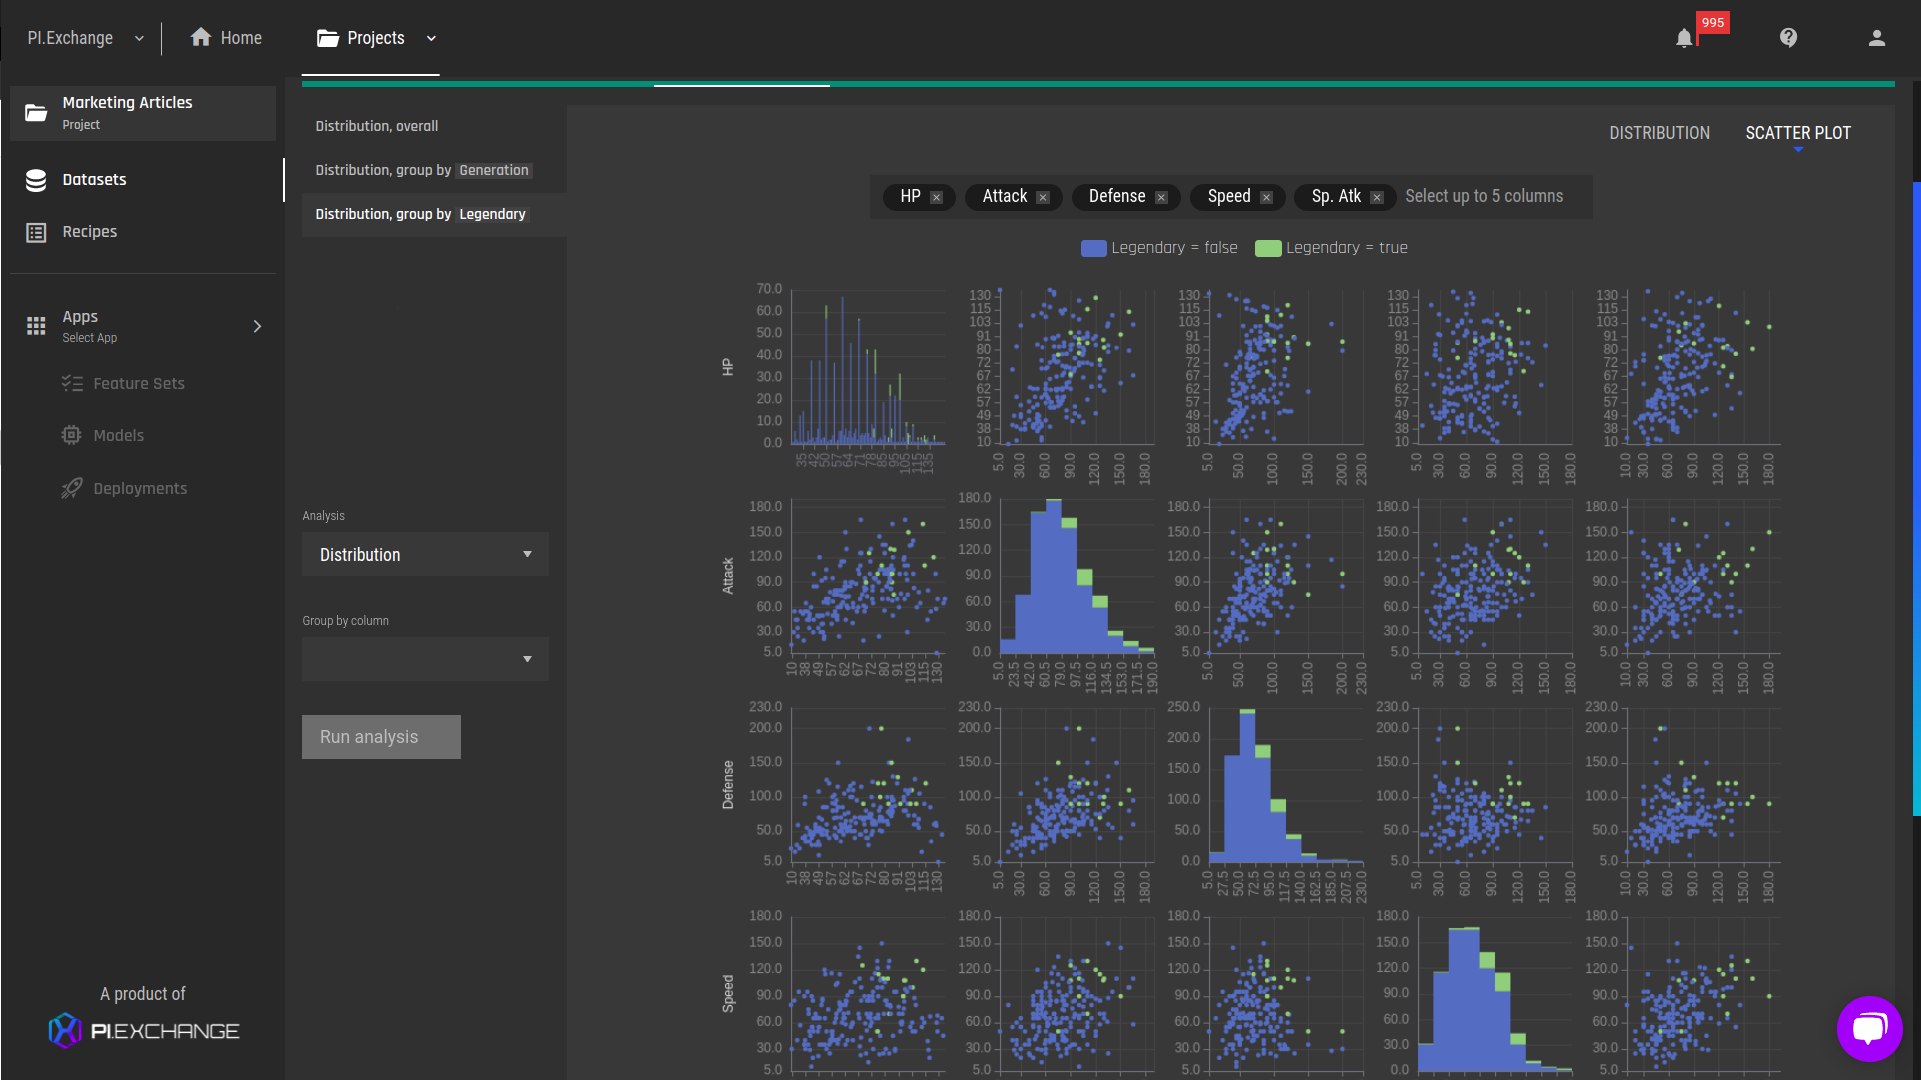
Fig 2 - Features analysis grouped by the "generation" feature

It seems that each generation of Pokémon has fairly similar feature distributions. Hence, we can deduce that "generations" aren’t really an important feature.

We can try finding natural groupings using the Pokémon's physical attributes (speed, attack, etc.). A pair-plot may help:

Pair plot (zoomed in)
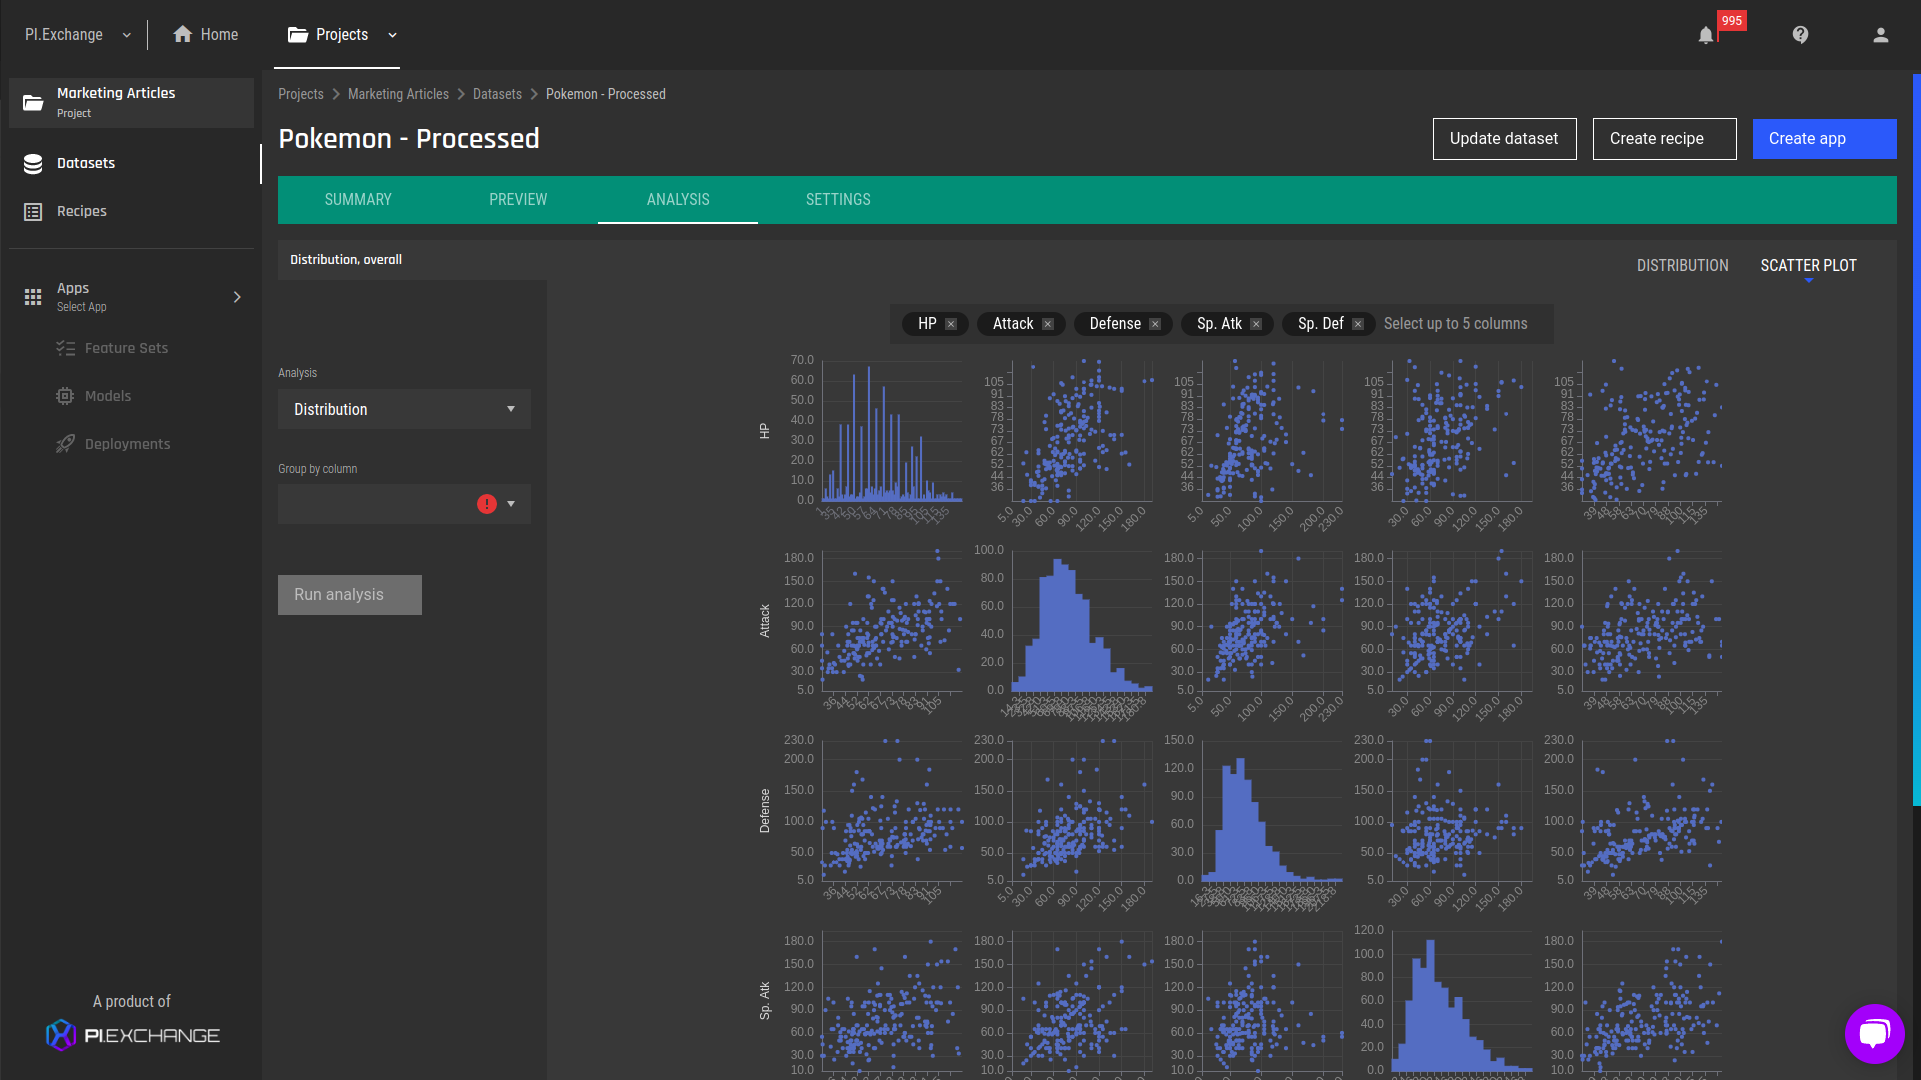
Fig 3 - Pair plot (zoomed in) - physical attributes

We can definitely see correlations (for example, "Defense" is positively correlated to ''Attack" meaning they tend to be higher together), but it is difficult to find any groupings, not to mention explain them using this type of chart, and the given data. We begin to understand that we need something else.

Clustering app - formulating the problem

As we saw earlier, standard data analysis tools may not be useful for finding natural groupings and require laborious manual analysis. In our case, we would like to automate the process, to do so, we can use the clustering app.

Our goal will be to discover natural groups using the physical Pokémon attributes, e.g: "HP, Attack, Defense, SP. Atk, Sp.Def and Speed".  However, as a sanity check, we’ll start by using all the physical attributes plus one more feature: "Legendary", because we have a reason to believe that legendary Pokémon should be quite different from the others. After all, they’re legendary!

Legendary Pokémon are the “strongest” ones, and hence, they should exhibit physical features that are on the high end. We can easily see this using the data analysis:

Pair plot (zoomed in)Fig 4 - Pair plot (zoomed in) - physical attributes grouped by the "Legendary" feature. The green dots represent the feature values for legendary Pokémon, and we can easily see that their physical attribute values are much higher compared to the non-legendary Pokémon.

We would expect the AI & Analytics Engine to find at least 2 distinct groups when using this set of features. Later, we will drop this feature, and let the clustering app attempt to find natural groupings without it. Manually doing this is much harder!

Clustering app - implementation

Scenario 1: Clustering with "Legendary" column

For the 1st scenario, we will go into the full details of how to implement all the stages of a clustering app, and how to understand the generated analysis. We start by creating a new app:

New app creation on the AI & Analytics Engine                                                             
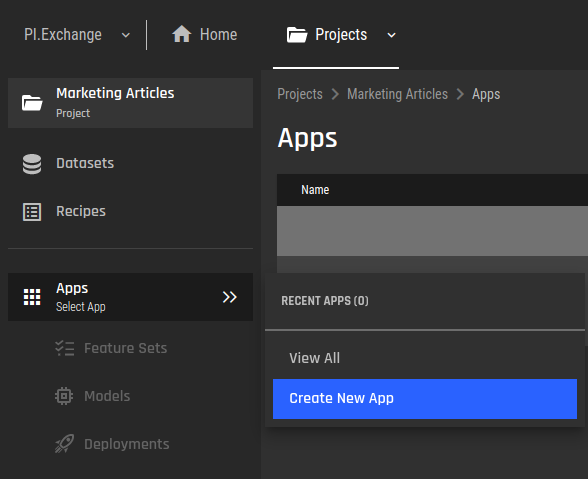
Fig 5 - New app creation

We then chose to use the clustering app and select the dataset to be processed:

Selecting clustering app on the EngineFig 6 - Selecting the clustering app

We proceed with selecting the required columns for the clustering. This step is required since the user has to be the one who decides which columns should be considered while determining whether two Pokémon are similar. Notice to assist the user, we supply a view of the distributions of the columns.

Selecting features for clustering on the EngineFig 7 - Selecting features for clustering

Now, we need to select the clustering algorithms. We will begin by choosing a “classical” algorithm: Gaussian Mixture Model (GMM). Going into the details of this algorithm is beyond the scope of this blog. We do not know upfront how many clusters we’re going to find, so we just use the default settings, which will search a range of options and choose the best one for us automatically:

Selecting a clustering algorithm on the Engine
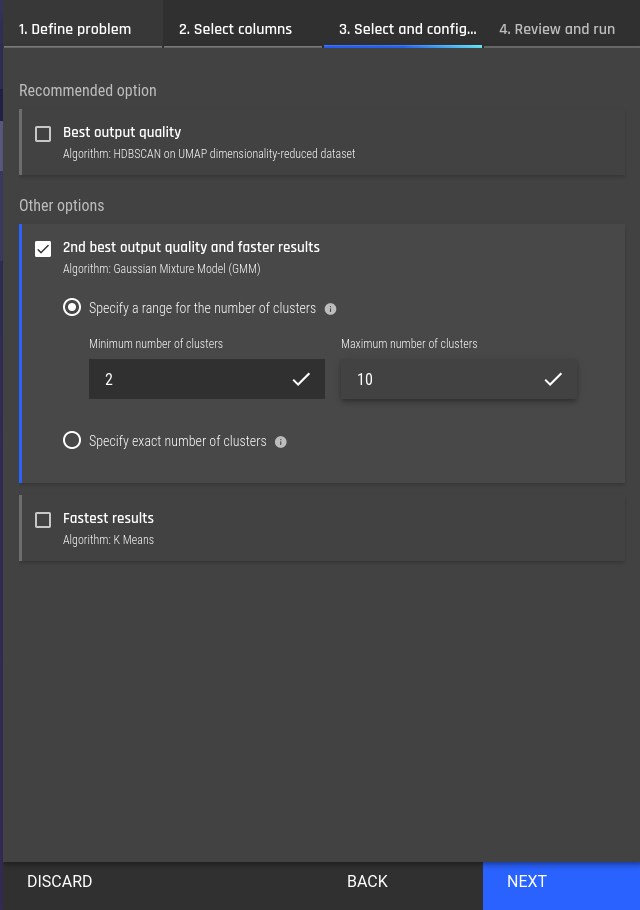
Fig 8 - Selecting a clustering algorithm

Finally, we review the app configuration, and proceed to the clustering:

Review the clustering configuration
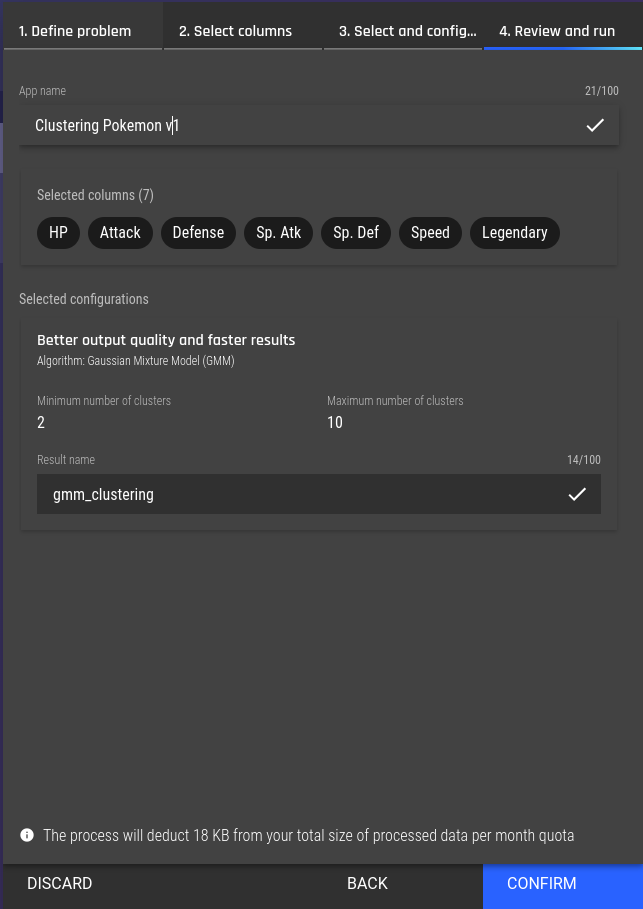
Fig 9 - Review the clustering configuration

We then move on to the clustering app window. We can see important information, such as the size of the dataset, the user that created it, the selected columns for clustering, and the current progress of training clustering models. and models that finished their training.


Fig 10 - Waiting for the clustering to finish processing

Once the training has finished, we can review the analysis results, and “understand” our clusters and export the results. We have a lot of information, so the following video snippet is just an overview. We will immediately dive into these results in the following overview:

Clustering Analysis Overview Video:

Fig 11 - Clustering analysis overview

Walkthrough of Clustering Analysis Overview

Firstly, we see a summary of the analysis. The critical information is that GMM discovered 2 clusters, as we suspected we have when viewing the data analysis grouped by the "Legendary" feature. Additionally, GMM managed to cluster all the available data records.

Summary of the Analysis

Summary of GMM clustering resultFig 12 - Summary of GMM clustering result

Next, we can view a low-dimensional (2D) representation of the data, where each record of Pokémon features (a 7D vector) is mapped to a point in this representation:

2D representation of Pokémon clustersFig 13 - 2D representation of Pokémon clusters

Furthermore, we can highlight the clustering assignments. We see that it almost fully matches the presented structure, which is, basically two blobs of points which represent two clusters.

Pokémon cluster on the EngineFig 14 - representation of Pokémon clusters with GMM clustering assignments

Before we deep dive into explanations, we can already have some idea regarding the differences between the clusters using the “Cluster profiles” tab.

Clustering profile on the AI & Analytics Engine
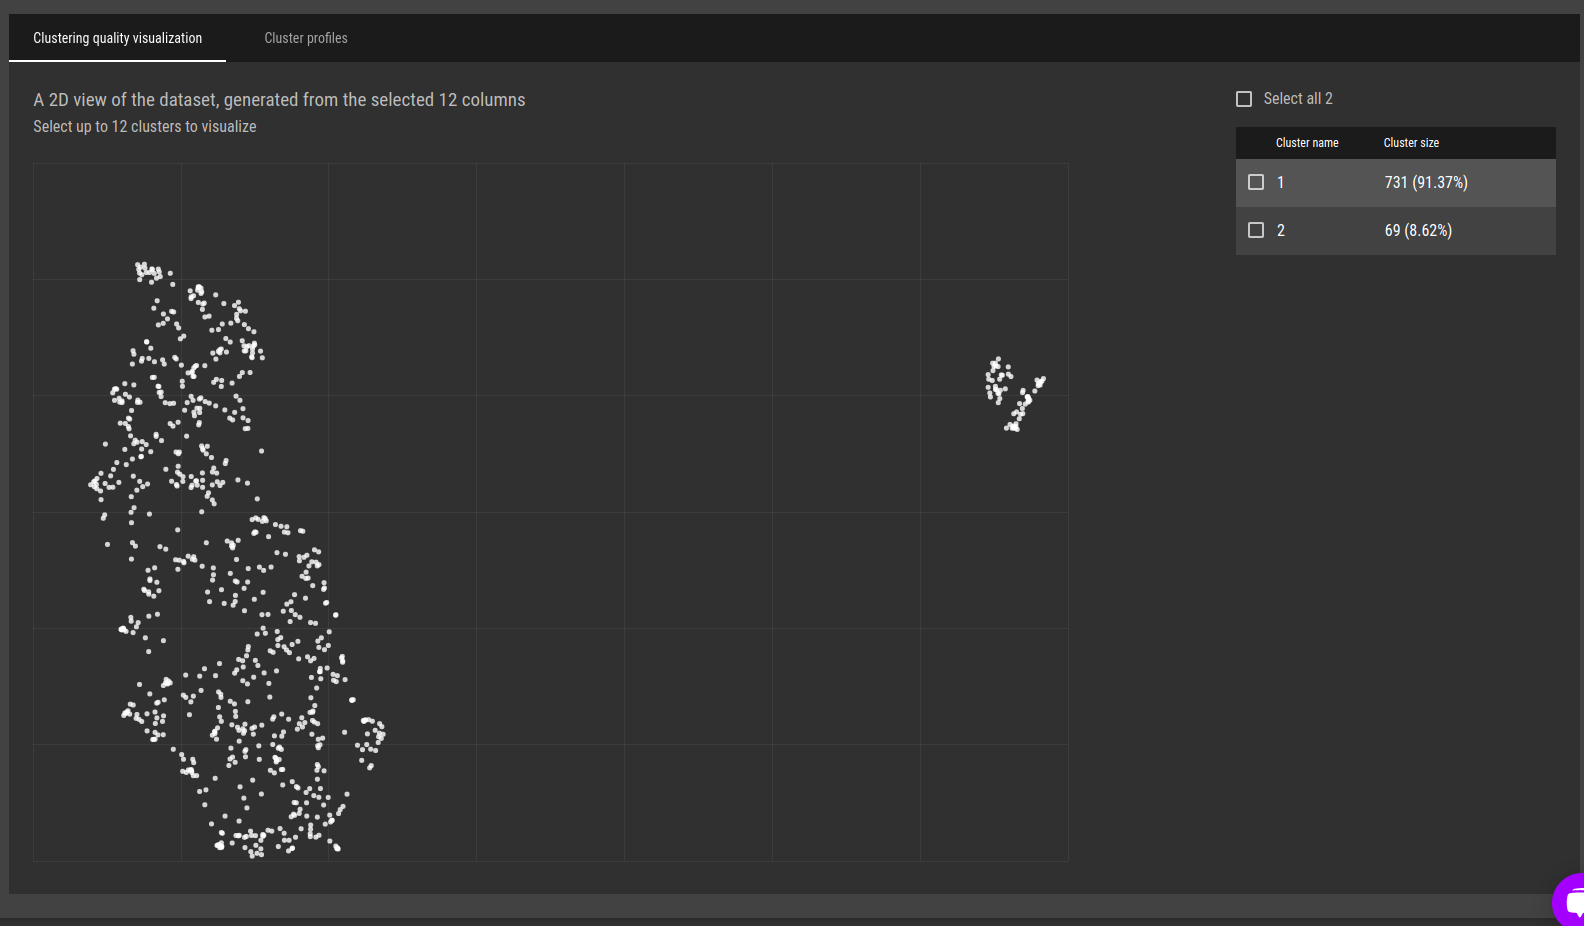
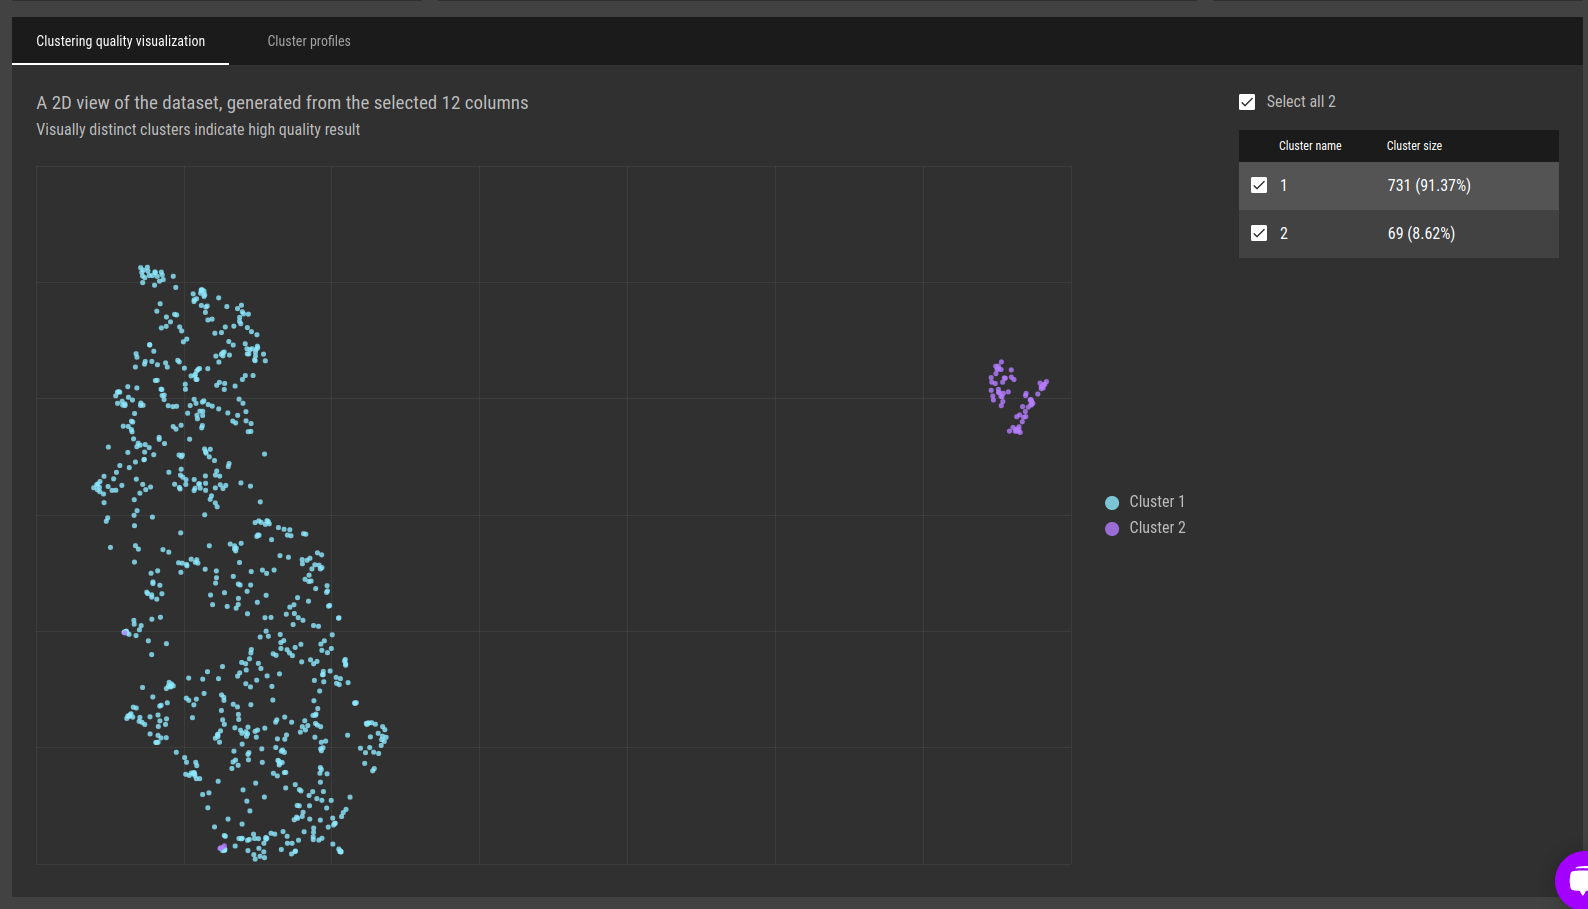
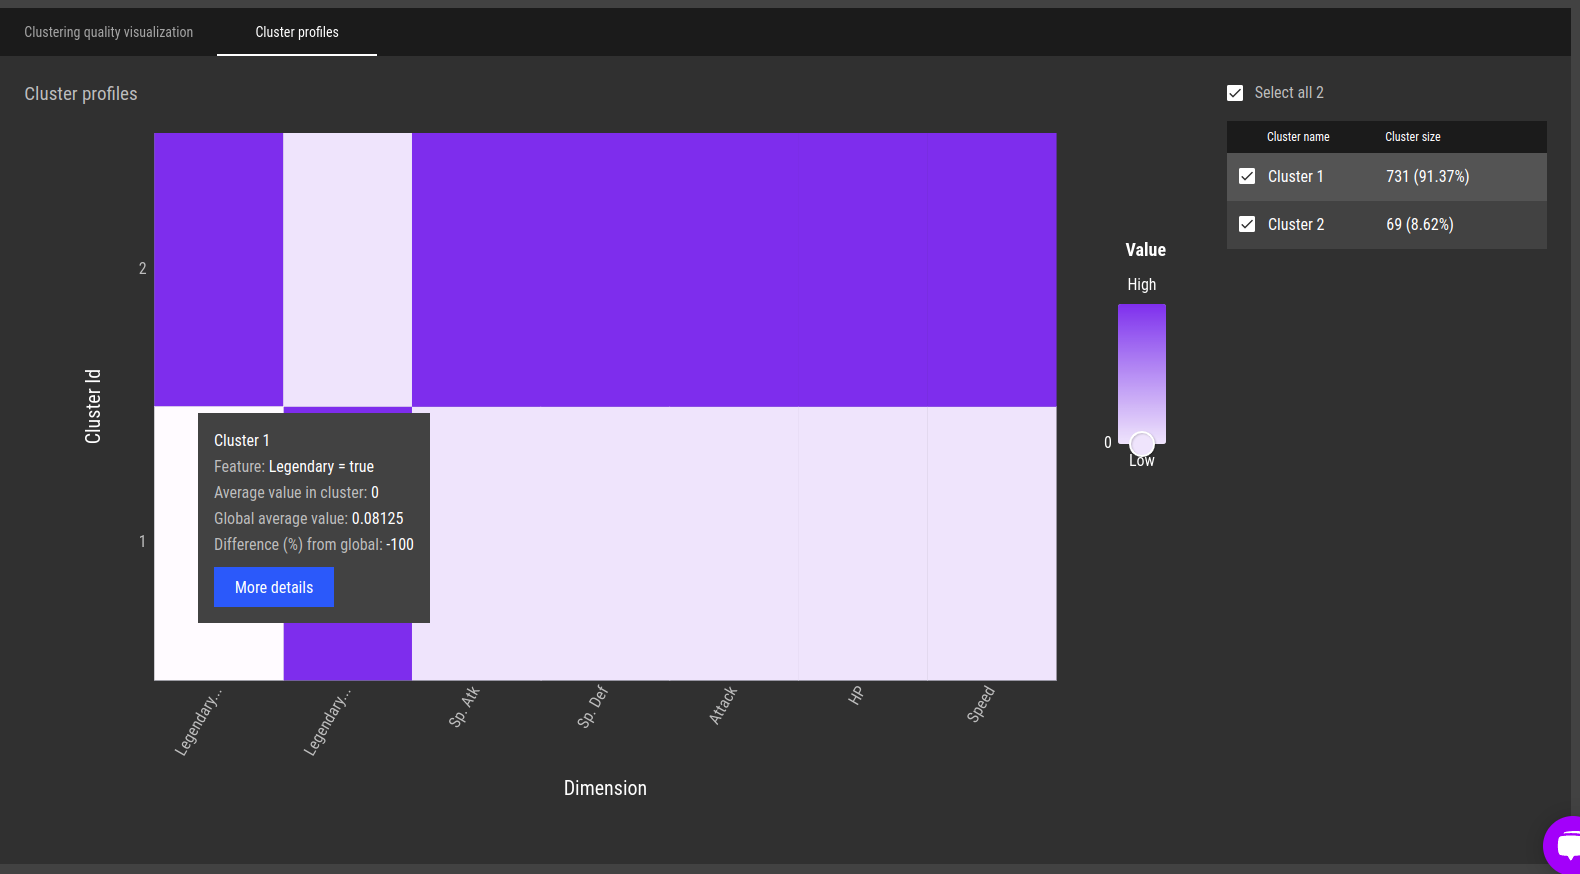
Fig 15 - Clustering profiles. A high-level overview of the differences between the clusters

On the y-axis, we see the two clusters that we have.

On the x-axis, we have the most important features (in this case, all of them) that helped separate the clusters. The color of each cell indicates what is the feature average value for a specific cluster and feature, compared to the average of that feature across all clusters. In other words, if we have strong color differences for a feature between clusters, it means that the average feature value differs greatly between the clusters, and thus is a good “separating” feature.

For example, we can see that for cluster 1 (the larger of the clusters, containing 731 points), the "Legendary_true" feature (It is the original "Legendary" feature separated into the categories that it contains, either "true" or "false") is zero! Which is 100% lower than the average and indicates that all the Pokémon in this cluster are not legendary Pokémon.

On the other hand, we see a high value (above average) for that feature in the 2nd cluster, which implies the opposite. I.e. The smaller cluster is a cluster of legendary Pokémon.

Additionally, we can also see that on average, the physical attributes of the legendary Pokémon (cluster 2) tend to have higher values, which agrees with what we saw in the analysis grouped by the "Legendary" feature.

Next, we would like to get some “rules” that will tell us exactly how to separate these clusters. We can get them using the “detailed description” of clusters.

Let us, deep dive, into cluster 2:

Detailed description for cluster 2
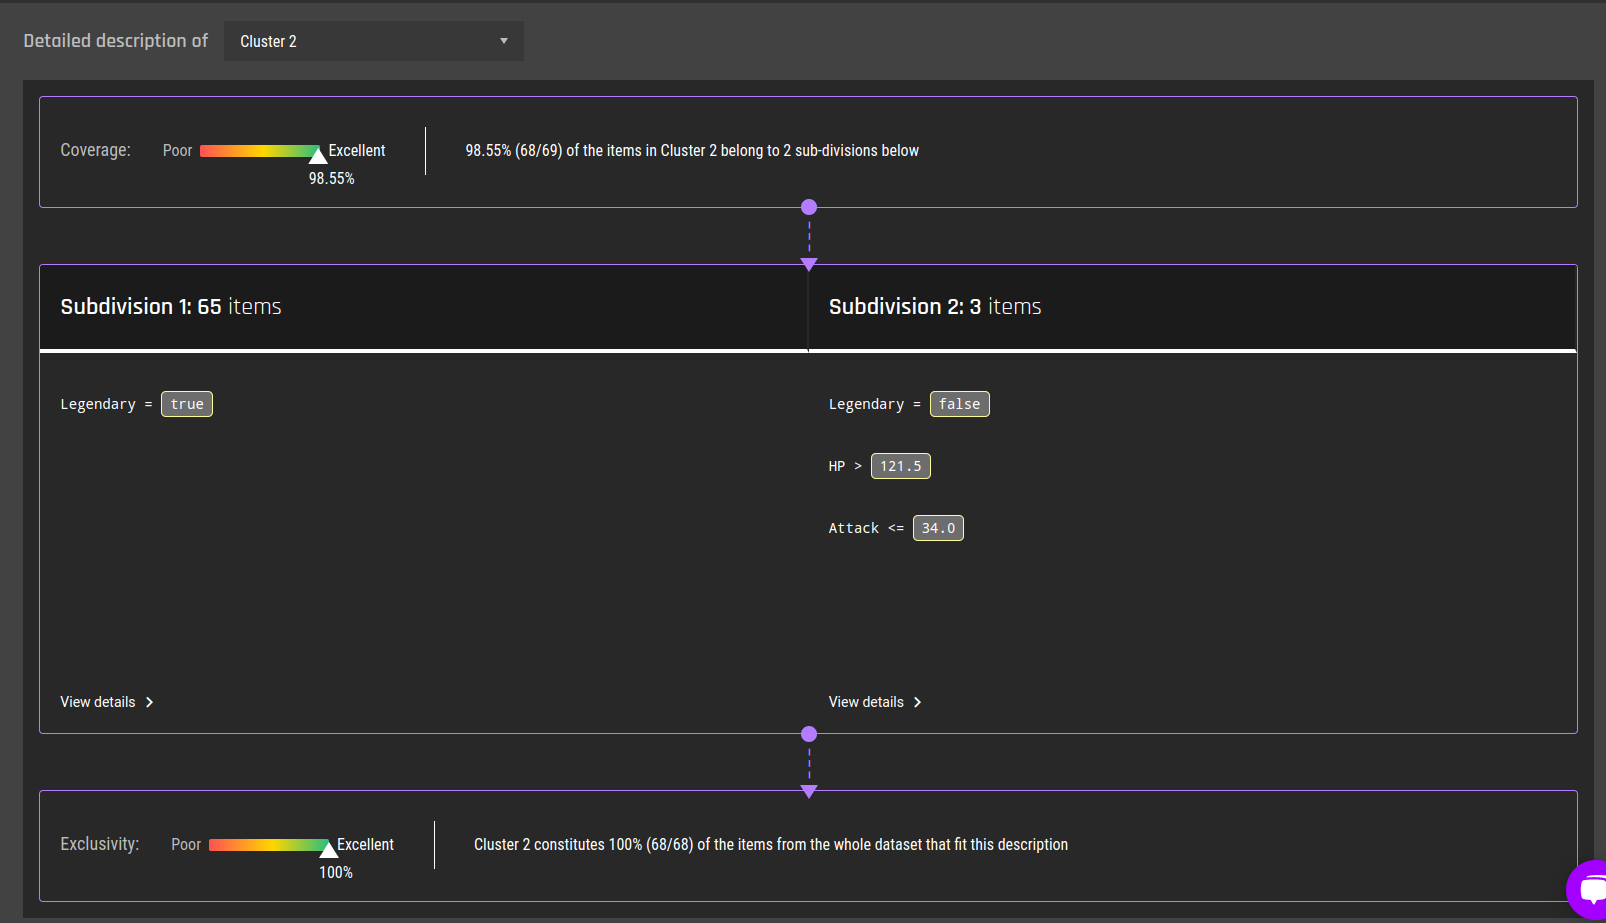
Fig 16 - Detailed description for cluster 2

First, we observe the coverage for that cluster. The coverage shows the percentage of items in the cluster for which the generated description applies. We also have exclusivity, which shows whether the items to which the description applies mostly belong to the selected cluster.

Our coverage and exclusivity are excellent, and we can see that our descriptions explain all the records (Pokémon) in the cluster apart from one.

The rules are also simple. First, we see that we can describe 68 out of 69 total points in the cluster by two simple rule sets, called “subdivisions”.

Most of the records that were assigned to cluster 2 (65 items) have a simple rule: "Legendary = True".

For the other remaining 4 records, we have 3 that can be described in subdivision 2. specifically, they are NOT "Legendary" but still have a high value of hit points (HP), which is > 121.5, and lower values for "Attack" which are < 34.

If the user is interested in digging even deeper into a specific subdivision, it is possible by clicking on the ‘view details' within the subdivision described in the appendix.

Scenario 2: Clustering without the "Legendary" column

In this section, we’ll skip the full details and get to the core of our target question. Given only the physical attributes of ['HP', 'Attack', 'Defense', 'Speed', 'Sp. Atk', 'Sp. Def'] can we find natural groupings?

Since we covered the full steps in the previous section, we’ll skip them now. The only change we’ll do in the app creation process is selecting the recommended algorithm (UMAP + HDBSCAN, which is considered to be more robust relative to the GMM we used in scenario 1) in the algorithm selection stage when creating an app.

After configuring the app and running the training we get the analysis results. I will briefly cover the main conclusions that we can infer after observing the results:

Summary:

UMAP summary on the EngineFig 17 - Summary of UMAP + HDBSCAN clustering over (only) the physical attributes of Pokémon

The key information:

  • We applied the algorithm only on the physical attributes of Pokémon.

  • We found 4 clusters.

  • One of the clusters represents “noise points” which aren’t actually considered to belong to any cluster. We can also see that the algorithm failed to assign a cluster to 5% of the records (40 Pokémon).

Next, we want to get some visual representation of the clusters:

Low dimensionality representation of records
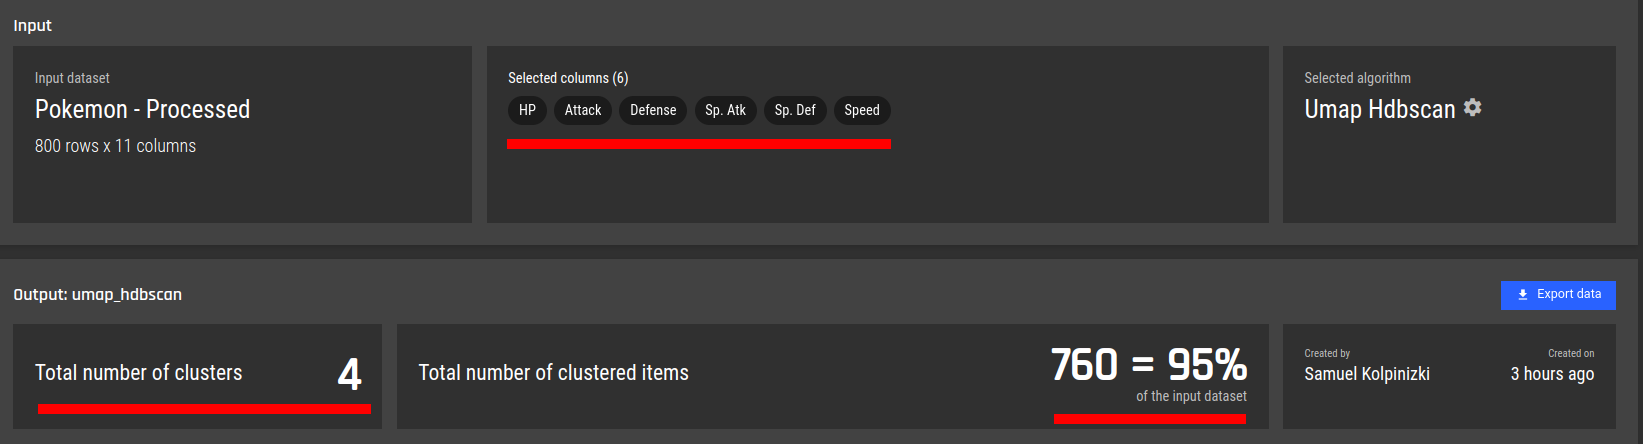
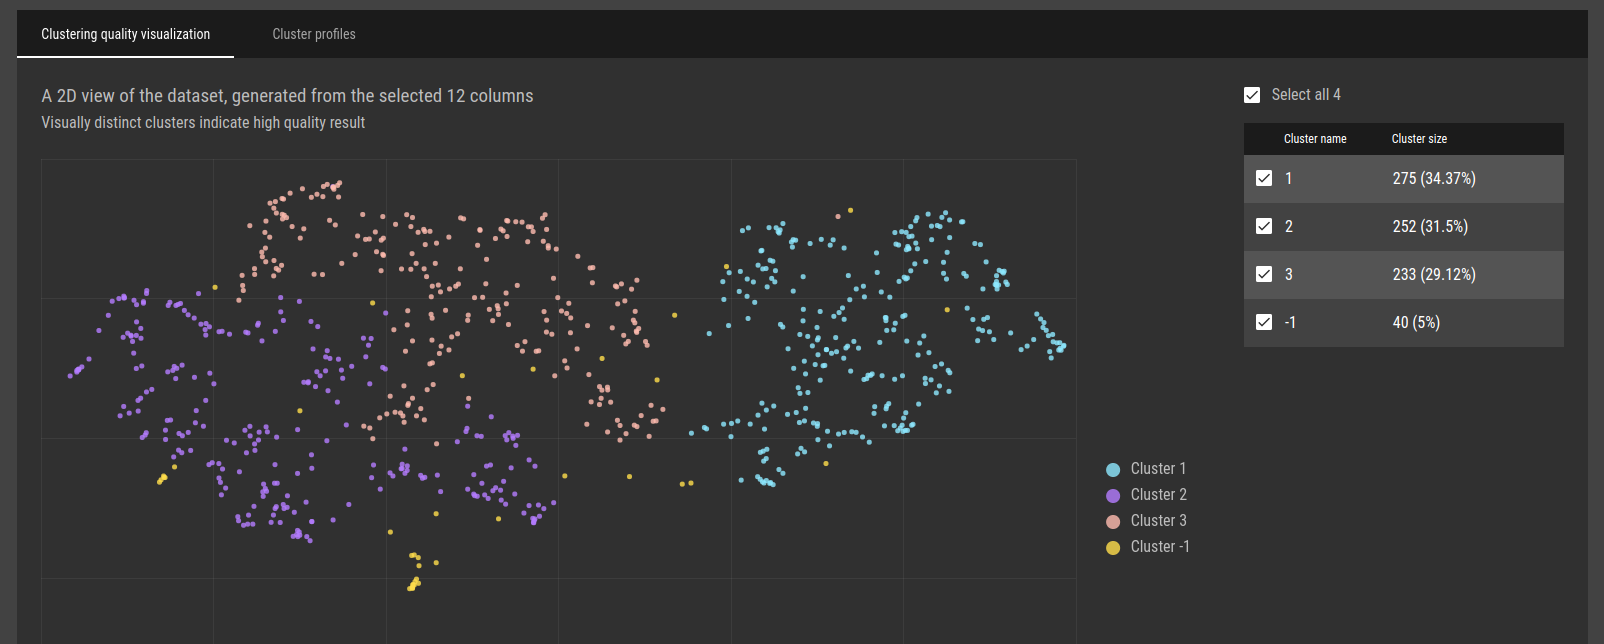
Fig 18 - Low dimensionality representation of records

The key information:

  • Visually, seems like one can argue that there are actually 2 distinct groups, not 3, but it’s arguable. In any case, the close proximity of points, at least between "Cluster 2" and "Cluster 3" indicates that these groups probably don’t differ by much.

  • Some noise records are evident and spread out evenly.

Continuing, we look at the cluster profiles to obtain a high-level understanding of the differences between the clusters:

Custer profile on the EngineFig 19 - Cluster profiles

  • The main difference between clusters is that the average values of the features of "cluster 1" are lower than their average values across all clusters, while the average values of the features of "cluster 2" and "cluster 3" seem to be higher than their average values across all clusters.

  • "cluster 2" and "cluster 3" are pretty similar. Seems that (on average) "cluster 2" has higher values of "Attack" and "cluster 3" but "cluster 3" has (on average) higher values for "Speed".

    At this point, we already have a sense of the different groupings of Pokémon. If we combine "cluster 2" and "cluster 3", we can basically get groups of:

    • Strong Pokémon.

    • Weak Pokémon.

    Which is not surprising. Additionally, we can break down the strong Pokémon into 2 additional groups:

    • Pokémon that will usually be the first to attack. (higher "Speed").

    • Pokémon that are stronger (higher "Attack").

    If we’re happy with this explanation, we can export the data together with the clustering id column into the platform, or as a downloadable file.

    Exporting data
                                                  Fig 20 - Exporting results as a CSV file

If further information is needed, we can keep going with the flow as before, and get a detailed analysis. For example, let’s try to describe "cluster 3":

15_details_analysis_target_use_caseFig 21 - Detailed description for "cluster 3"

We first need to take into account the fact that for this cluster, the coverage is a bit lower compared to the previous section. However, it’s still good. So the subdivision explanation below applies to most of the items in this cluster.

We already expect this cluster to have strong Pokémon in general, and with a higher "Speed" on average and we see that the largest subdivision indeed has "Speed > 80.5" (which is high).

This time, we won’t dive deep into all subdivisions for all clusters.

As a final note, for "cluster 3", the exclusivity of the descriptions is good, but not great. Basically, it means that there are also (quite a few) other points not in "cluster 3", but you can still describe them with the same rules.

Conclusion

We started with a dataset of Pokémon characters and asked a question:

"Can we find natural groups within this dataset?"

We saw that even though we can find some clear separations using data analysis and grouping by some features, it is difficult to perform if we try to find groupings based only on the physical attributes of the Pokémon.

We then demonstrated how we can automatically perform such an analysis using the clustering app of the AI & Analytics Engine.

Within a very short timeframe (around 15 minutes) we not only managed to get a clustering result ready to download or integrate back into the Engine but also got a detailed analysis that breaks down the clustering decisions, from a high-level perspective of differences between the clusters, down to the exact rules and numerical values that separate each cluster.

Appendix: Subdivision details

Reminder: In scenario 1, we got 3 subdivisions. To demonstrate the subdivision details, let us use subdivision 2 which has only 3 items in it:

Details of subdivision
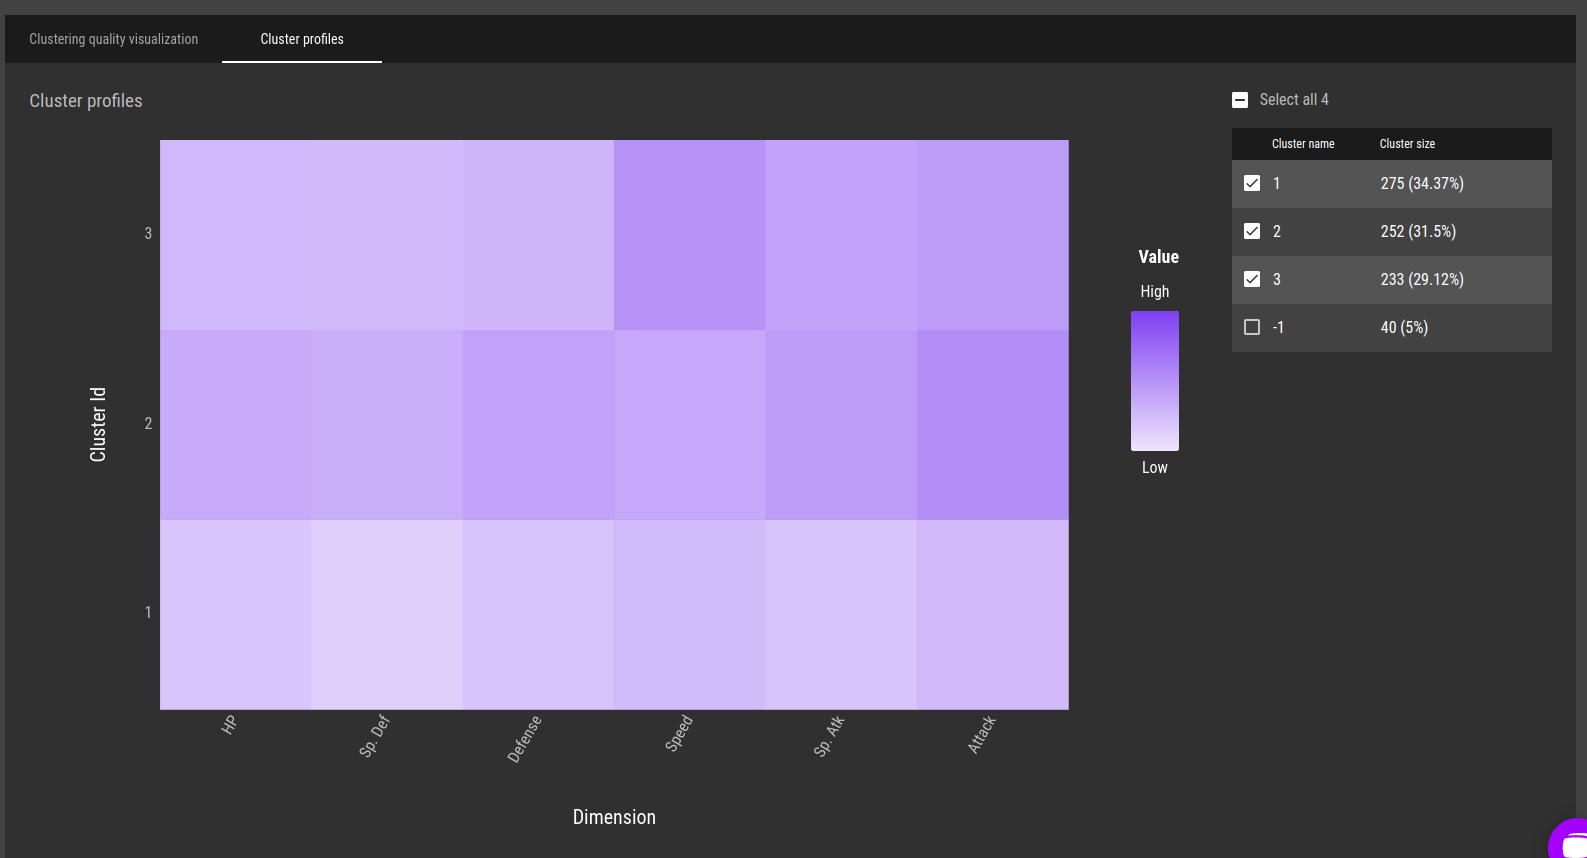
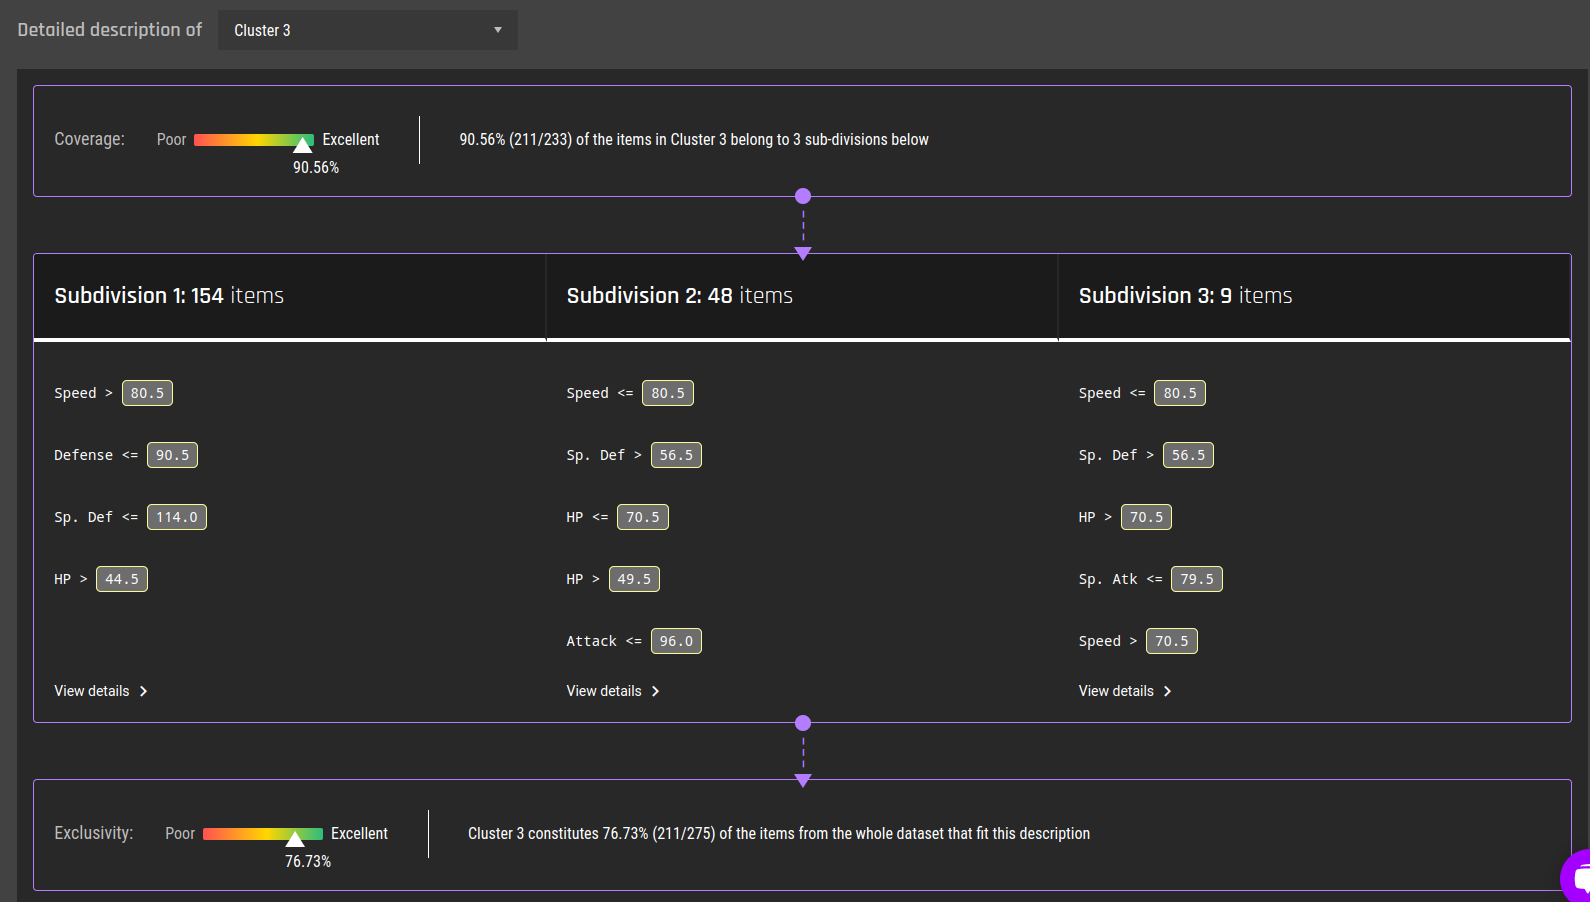
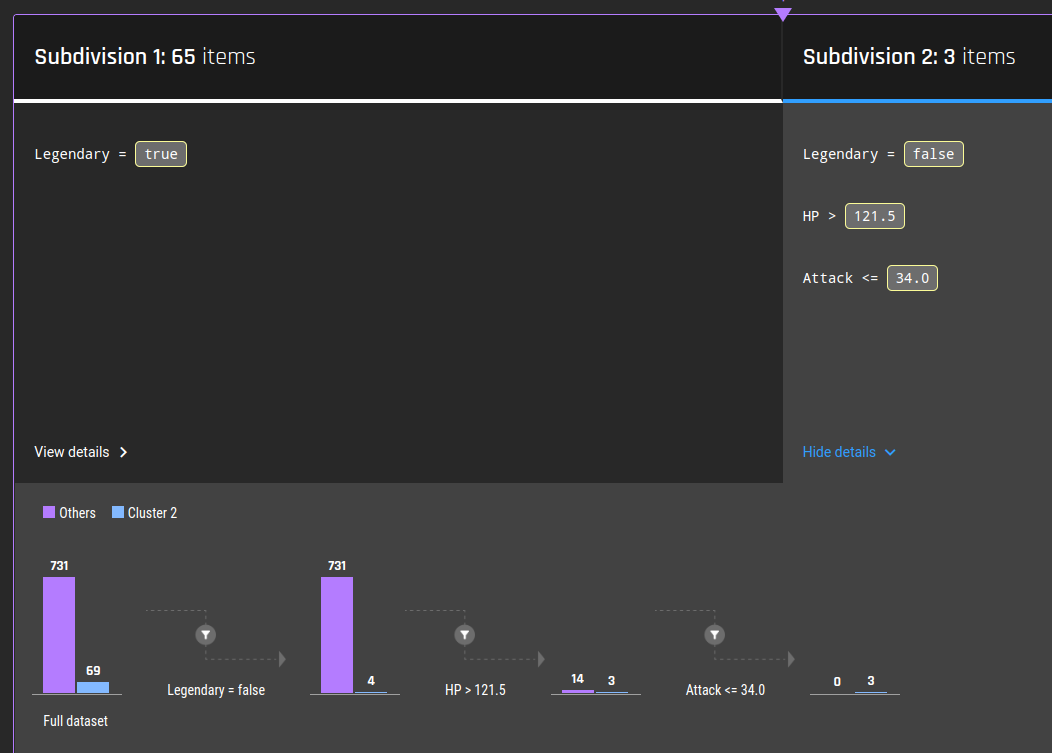
Fig 22 - Details of subdivision 2 for cluster 2

We begin reading on the left side:

  • The full dataset has:

    • 69 records belonging to cluster 2.

    • 731 records belonging to all other clusters.

  • We filter using the rule in the subdivision: "Legendary = False". The “Others” remain with 731 points (we know that cluster 1 actually contains all the non-legendary pokémons), but within cluster 2, we now have only 4 items that are not legendary.

  • We further check how many have HP > 121.5 . (Relatively high value)

    • 14 out of 731 in cluster 1.

    • 3 out of 4 in cluster 2.

  • Lastly, we check how many out of the filtered clusters have Attack < = 34:

    • 0 of 14 in cluster 1.

    • 3 out of 3 in cluster 2.

This completes the entire breakdown for the number of records for every rule in the subdivision of interest.

Alright, you may not need to cluster Pokémon any time soon, but we promise there is a multitude of use cases across domains. Clustering can be used within marketing to discover customer segments; Streaming Services to cluster content based on topics and information, and Insurance providers to cluster consumers that use their insurance in specific ways - to name but a few!

Not sure where to start with machine learning? Reach out to us with your business problem, and we’ll get in touch with how the Engine can help you specifically.

Get in touch


Similar posts