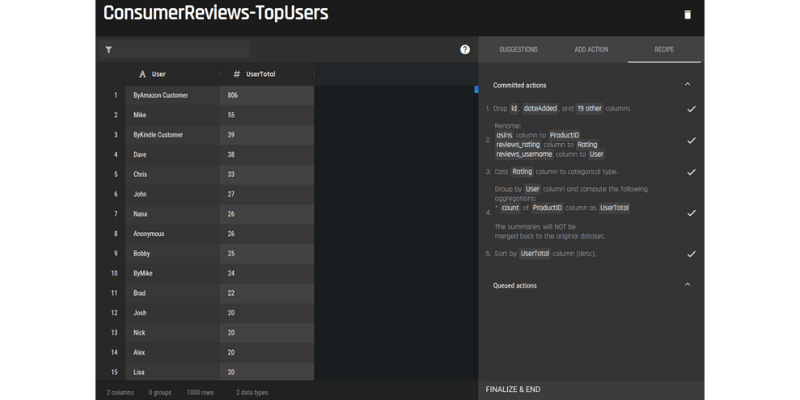
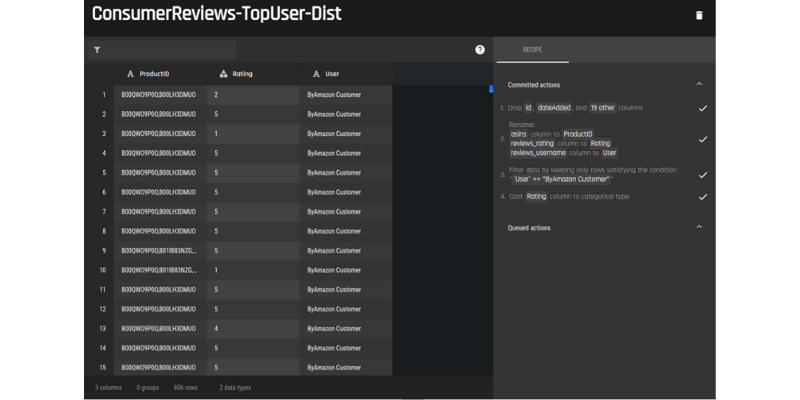
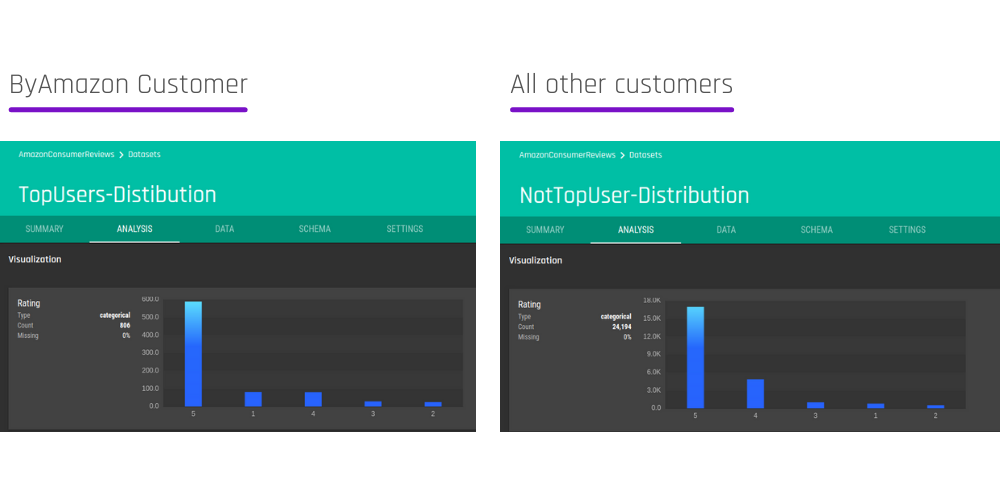
Data Preparation

Identifying if Amazon Customer Ratings are Genuine with the Engine


This 3-part blog series will showcase 3 unique use cases you can carry out, from using just one simple dataset. 

The first thing you need is the right data. The right data refers not just to the quantity, but its quality as well. The next step is to prepare and clean your dataset and choose the specific data or columns of data that are pertinent to the outcome you wish to predict. You can then use the AI & Analytics Engine to evaluate and analyze the results. Specifically, by using AutoMl solutions like the AI & Analytics Engine, you can go through the entire process of data upload, data preparation, data visualization, and model creation and deployment. Read more about AutoMLs here

The dataset we will be using is the Consumer Reviews of Amazon Products from Kaggle. Using this dataset, these are the use cases we will be demonstrating over the next 3 weeks:

  1. Identifying if customer ratings of a product are genuine

  2. Calculating your Net Promoter Score (NPS)

  3. Building a product recommendation system for your customers

In this first part, let’s look at identifying if a certain user’s reviews/ratings are genuine. Feel free to download the dataset and follow along with the steps, with a free trial of the AI & Analytics Engine!

Consumer reviews give businesses insights into how their customers feel about their products. More so than that, they also provide other potential customers with first-hand experiences and opinions. That being said, fake reviews are growing in numbers, with companies resorting to drastic means to elevate their products' popularity. The scenario of competitors attempting to manipulate the rating system by leaving fake negative reviews is one that is also not unheard of.

How can we tell if certain ratings or reviews are genuine?

In this article, we show you how you can use the AI & Analytics Engine to quickly prepare your data to easily analyze large datasets of customer reviews, and identify genuine ratings. For this illustration, we’ll be using the Consumer Reviews of Amazon Products from Kaggle. With up to thousands of reviews being received every day by businesses, having an automated system that can handle such large amounts of data is necessary. Thankfully, the AI & Analytics Engine comes equipped with this capability.

Data Exploration

Are the ratings genuine?

  • Are there any users making a suspiciously high number of ratings?

  • What does the distribution of the ratings look like?

Steps to see the number of ratings submitted by each user:

Step 1: Dataset upload

The AI & Analytics Engine supports different formats of data uploads like CSV, Excel, etc. 

Step 2: Data preparation

  1. Using the drop column feature, drop the columns that we don’t need and, and rename them. The columns we need are the usernames used to leave the review and the number of reviews submitted by that user. We’ve renamed them User, and UserTotal respectively.

  2. Group the data by User using the count function. This gives us the number of reviews by each specific user.

  3. Finally, sort the rows by the total number of reviews per user.

The image below shows us the preview of how the dataset looks after carrying out these data preparation steps.

Data preview after data preparation

If you take a closer look, you’ll see that an alarmingly high number of reviews were submitted by the user “ByAmazon Customer”. To see if these reviews are genuine or simply just bulk reviews submitted by one entity,  we will set out to compare the distribution of the ratings from this user and other users.

To visualize and compare the distributions of their ratings, we will:

  1. Go back to the original dataset and drop the columns we don’t need. We will also rename the columns for easier distinction. Here, we end up with the columns ProductID, Rating, and User.

  2. Next, we filter the rows by User.

  3. Finally, we cast the Rating column to categorical.

Dataset preview

The above is a preview of what the dataset will look like. It has the specific columns we are interested in and is filtered accordingly. It is now ready for the next step. We will commit the actions and finalize them. After that, we will be able to see the data distribution in the Analysis section, as seen below.

There you go! Here is the rating distribution for the user “ByAmazon Customer” (on the left) and the rating distribution for all other users (on the right).

Data visualization of rating distribution

From the above image, we can compare ByAmazon Customer's rating distribution, with the rating distribution from all other users. By doing so, we can observe that the reviews from both "ByAmazon Customer" and other users follow a similar distribution. Therefore, despite "ByAmazon Customer" having written a bulk of the reviews, we can go ahead and assume that it is not a spam account. We can follow the steps above to generate the rating distribution of any other customers of interest. If a user’s rating distribution differs from all the other users, it would be safe to assume that the ratings may be coming from a spam account.

Wrapping Up

In this article, we show you how you can use the AI & Analytics Engine to easily prepare your data in a few steps, without any code. After your data has been prepared to your desired level, you can use the Engine to evaluate and analyze the results with the Engine's data visualization feature. 


Not sure where to start with machine learning? Reach out to us with your business problem, and we’ll get in touch with how the Engine can help you specifically.

Get in touch

Similar posts