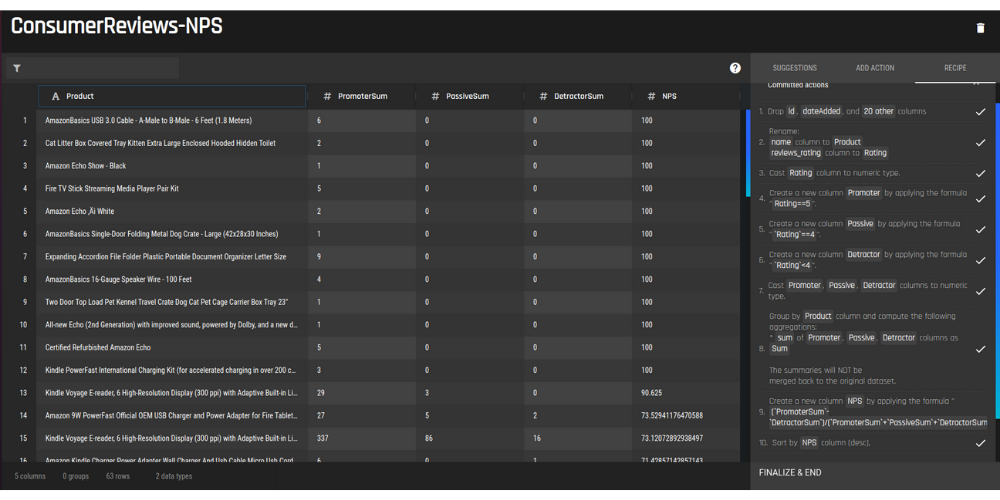
Data Preparation

Calculate your Net Promoter Score with the AI & Analytics Engine Pt. 2


Welcome to part 2 of our 3 part series where we use the Amazon Product Review dataset to showcase 3 unique data preparation use cases, with the AI & Analytics Engine. 

The first thing you need is the right data. The right data refers not just to the quantity, but its quality as well. The dataset we’ll be using is the Consumer Reviews of Amazon Products one from Kaggle. In this article, we show you how to calculate your Net Promoter Score (NPS) with the Engine.

As a reminder, the AI & Analytics Engine takes you through the entire process of data upload, data preparation, data visualization, and model creation and deployment. No coding necessary on your part

For a recap of the other use cases, check out these articles: 

Part 1: Identifying if customer ratings of a product are genuine

Part 3: Building a Recommendation System with the AI & Analytics Engine

For other business use cases, check out our article on the Top 18 essential AI Use Cases in Leading Industries!

Let’s jump right into it!

Net Promoter Score (NPS) is a metric that companies can use to measure and evaluate their customers’ loyalty to their product and company. To calculate your NPS, you would use this formula:

NPS = (Promoters - Detractors)/Total ratings * 100

By calculating and evaluating your findings, you can make relevant data-driven business decisions. For instance, you can identify and reward your loyal customer base or try to grow your loyalty among your less satisfied customers.

For this example, we will make the following assumptions on customer ratings:

Ratings of 1, 2, or 3 --> Detractor

Rating of 4 --> Passive

Rating of 5 --> Promoter

Steps to calculate the NPS for each product

Step 1: Dataset upload

The AI & Analytics Engine supports different formats of data uploads like CSV and Excel.

Step 2: Data preparation

  1. Drop the columns we don’t need and rename the remaining columns.

  2. Cast the Rating column to Numeric type.

  3. Create Promoter, Passive and Detractor columns, with rules on distinction based on the rating definitions discussed above.

  4. Group the data by Product and use the sum aggregation to calculate the total number of promoters, passives, and detractors for each product.

  5. Calculate the NPS using the formula. Create a new column, and apply the NPS formula to it.

  6. Finally, sort the rows according to the NPS.

The image below shows a preview of how the dataset will look after carrying out the above steps.

dataset preview

We can see there are a few products with an NPS of 100, but these don’t have many reviews. We should take into consideration the products with a higher number of reviews, for a more accurate NPS. We have decided to use the threshold of 100 reviews to evaluate products. Doing so, we observed that among products with more than 100 reviews, the “Kindle Voyage E-reader” has the highest NPS, while the “Kindle E-reader white” has the lowest NPS.

Wrap Up

That's it! Using the AI & Analytics Engine makes complex and tedious tasks like calculating your NPS much easier. And all in just a few steps.

Not sure where to start with machine learning? Reach out to us with your business problem, and we’ll get in touch with how the Engine can help you specifically.

Get in touch

Similar posts