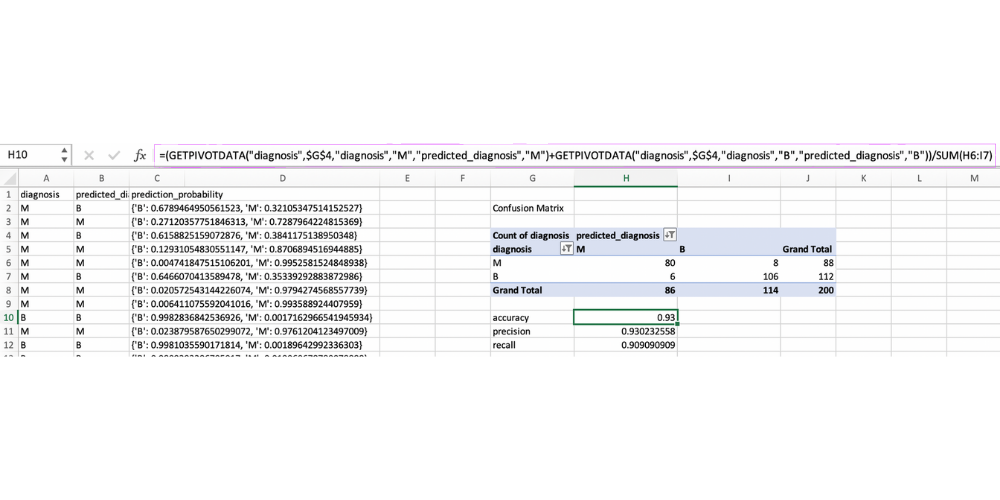
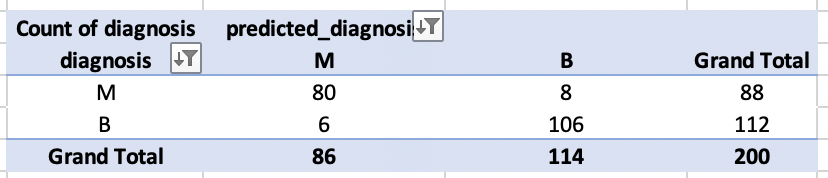
Model Performance

Testing models: Analyzing Batch prediction results using Excel


The AI & Analytics Engine automatically evaluates trained models based on a train/test split. In addition, the engine also caters to users who want to test, evaluate or analyze the model’s performance using their own test set that has not yet been uploaded to the platform, through the batch prediction feature.

In this article, we show you how you can use your downloaded batch prediction results offline to analyze your models' performance using spreadsheet software, such as Excel.

The batch prediction feature generates predictions from a model trained on the engine, based on an input file. The resulting file contains the prediction column(s) and can additionally include columns from the input file as an option.

The additional columns in the batch prediction file can be helpful in testing the model performance on new data offline. For example, the ground truth values of the target can be added to the input file for batch predictions. In that case, the batch prediction file generated by the engine contains both a ground truth value column (from the original input file) and prediction column(s) (added by the engine). We can analyze these columns to test the model performance. Such model testing is quite useful in deciding the next steps, such as determining whether we can continue to use the same model or if we need to fit a new model.

The figure below shows a part of an example prediction CSV file downloaded from the engine with both the ground truth values and predicted classes and prediction probabilities from a classification problem.

Figure 1 (above): Batch prediction output for a classification problem. Note that the other columns in the file are not shown in the figure for clarity.

Figure 1 (above): Batch prediction output for a classification problem. Note that the other columns in the file are not shown in the figure for clarity.

The following sections discuss two examples where we can use spreadsheet software, with Excel as an example, to analyze model performance based on these batch prediction outputs for a regression problem and a classification problem.


Analyzing regression model performance

Let’s use the “Ames Housing dataset” from Kaggle for this. You can get the dataset here. The dataset contains features related to houses, with house price as the target column. A model was already trained and deployed and batch predictions were obtained for 200 observations. The actual house prices for the same 200 observations are also available in the same batch prediction output.

Figure 2 (above): Batch prediction output for the house price prediction problem. The other input columns in the file are not shown in the figure for clarity.

Figure 2 (above): Batch prediction output for the house price prediction problem. The other input columns in the file are not shown in the figure for clarity.

These actual and predicted values can be used by Excel formulas to calculate different regression metrics used for evaluating the model performance. For example, below are screenshots illustrating the steps that we can take to calculate the root mean squared error and the “R squared” score of the predictions.


Step 1: Calculate the squared error for each observation using Excel formulas.

Step 1: Calculate the squared error for each observation using Excel formulas.

Step 2: Calculate the root mean squared error based on the squared errors.

Step 2: Calculate the root mean squared error based on the squared errors.

Step 3: Calculate the mean sales price (ground truth).

Step 3: Calculate the mean sales price (ground truth).

Step 4: Calculate the (sales price - mean sales price)^2 value for each observation.

Step 4: Calculate the (sales price - mean sales price)^2 value for each observation.

Step 5: Calculate r2 score based on squared errors and (sales price - mean sales price)^2 values.

Step 5: Calculate r2 score based on squared errors and (sales price - mean sales price)^2 values.

The calculations show that the predictions had a root mean squared error of 14058.58 and an “R squared” score of 0.97. Similar steps can be followed to calculate other metrics as required by the user.

Scatter plots are also useful in visually representing and evaluating regression model performance. The “actual vs predicted values” scatter plot is one such plot that is widely used. The screenshots below show how we can generate this plot offline from the batch prediction results using Excel.


Step 6: Insert → Scatter with sales price and predicted sale price columns as values.

Step 1: Insert → Scatter with sales price and predicted sale price columns as values.

Figure 3 (above): Actual vs Predicted scatter plot for House price prediction regression problem

Figure 3 (above): Actual vs Predicted scatter plot for House price prediction regression problem

Other useful plots such as “error (residual) vs predicted value” scatter plots or error (residual) histograms can also be generated in Excel using simple formulas and graphs.


Analyzing classification model performance

For the classification example, we use the Breast Cancer Wisconsin (Diagnostic) dataset from Kaggle (You can access it here). This dataset contains features related to breast cancer diagnostics and a binary target column describing whether the observation is a benign (B) or malignant (M) breast cancer case. This file is used to train a classification model using the engine. Then, we uploaded 200 new observations, with their corresponding labels, passed them through the trained model in the batch prediction mode, and downloaded the results back in CSV file format. The ground truth classes for these observations are also retained in the batch prediction file. See Figure 1 for a snapshot of the batch prediction file downloaded from the engine. Let’s assume that class M is the positive class.

The batch prediction results can be used to calculate the confusion matrix. The confusion matrix is quite useful in testing the performance of a classification model. Once the confusion matrix is obtained, it can be further used to calculate classification metrics such as accuracy, precision, and recall. The following steps illustrate how we can calculate the confusion matrix from the batch prediction file using Excel pivot tables. Then, this confusion matrix together with a few simple excel formulas is used to calculate the classification metrics.


Step 1: Create a Pivot table with diagnosis and predicted diagnosis

Step 1: Create a Pivot table (insert → Pivot Table) with sales price and predicted sales price as rows and columns.


Step 2: Calculate metrics such as accuracy, precision, and recall based on the values in the pivot table and Excel formulas (calculating accuracy metric is shown below as an example).

Step 2: Calculate metrics such as accuracy, precision, and recall based on the values in the pivot table and Excel formulas (calculating accuracy metric is shown below as an example).

Figure 4 (above): Confusion matrix

Figure 4 (above): Confusion matrix

The model is found to have an accuracy of 0.93, a precision of 0.93, and a recall of 0.91 for these new observations.

If we are interested in further examining the performance of the model, we can plot the predicted probability distributions of the ground truth positive classes and ground truth negative classes. The separation between these distributions is a proxy to the performance of the model. If they are highly separated, the model is less likely to confuse between the positive and negative records compared to when they are highly overlapping.

Plot two probability distributions as histograms

Step 1: Obtain the positive class probability from the “prediction probability” column. This can be done using Data → Text to Columns and Home → Find & Select → Replace functions in Excel.

Step 1: Obtain the positive class probability from the “prediction probability” column. This can be done using Data → Text to Columns and Home → Find & Select → Replace functions in Excel.

Step 1: Obtain the positive class probability from the “prediction probability” column. This can be done using Data → Text to Columns and Home → Find & Select → Replace functions in Excel.

Step 2: Get the probabilities when the ground truth class is positive (M) and negative (B). Since Excel histogram doesn’t work with non-numeric cells (e.g. empty cells) we use a value of “5”, which is outside the range of probabilities to fill the null values.

Step 2: Get the probabilities when the ground truth class is positive (M) and negative (B). Since Excel histogram doesn’t work with non-numeric cells (e.g. empty cells) we use a value of “5”, which is outside the range of probabilities to fill the null values.

Step 3: Calculate probability counts for each bin in the histogram (Data → Data Analysis → Histogram).

Step 3: Calculate probability counts for each bin in the histogram (Data → Data Analysis → Histogram).

Step 4: Plot the histogram based on the bins and counts (Insert → 2-D Column).

Step 4: Plot the histogram based on the bins and counts (Insert → 2-D Column).

Figure 5: Prediction probability distribution histograms for positive (M) and negative (B) classes.

Figure 5: Prediction probability distribution histograms for positive (M) and negative (B) classes.


Wrapping up

Here we demonstrated how we can use the batch prediction feature in the AI & Analytics Engine and Excel package to test model performance offline for new data points using two examples from two different machine learning problem types: regression and classification. Analyzing the performance of predictive models over new data points is crucial for businesses to determine whether the current model can continuously be used safely or they need a new model. As such, being able to seamlessly integrate results generated by the engine with popular spreadsheet software like Excel is another aspect of the AI & Analytics engine helping us advance toward our goal of empowering everyone with machine learning.


Not sure where to start with machine learning? Reach out to us with your business problem, and we’ll get in touch with how the Engine can help you specifically.

Get in touch

Similar posts