How to use the AI & Analytics Engine’s Google Sheets Integration
In this blog, we’ll show how to import data using the AI & Analytics Engine’s Google Sheets integration, so you can build machine learning models.
The AI & Analytics Engine is a no-code automated data science/machine learning (ML) platform envisioning the democratization of AI. The number of players in the field of no-code automated AI-as-a-Service (AIaaS) providers is increasing every day, providing a wide range of options available for users seeking such tools. Recently joining this class of services, is Amazon SageMaker Canvas developed by Amazon Web Services (AWS).
In this article, we will be comparing the capabilities of the AI & Analytics Engine and the SageMaker Canvas. Specifically, these are the features we will be comparing:
Data Import
Model Selection and Training
Model Evaluation Results
Obtaining predictions from the model
Both SageMaker Canvas and our AI & Analytics Engine are no-code ML platforms intended for use by non-technical users to build, evaluate, and test their models using their own data, as well as to obtain predictions from trained models. Users have the option to train classification, regression, and time,-series forecasting types of models.
The AI & Analytics Engine provides a single connected set of tools for the end-to-end journey starting with raw data and includes data preparation, model training, deployment, and monitoring. On the other hand, SageMaker Canvas is a tool focused solely on model training and predictions, forming a part of the AWS ecosystem. Connecting multiple AWS tools to build an end-to-end pipeline is not an entirely straightforward process.
The overall processes for both SageMaker Canvas and the Engine are summarised in the image below:
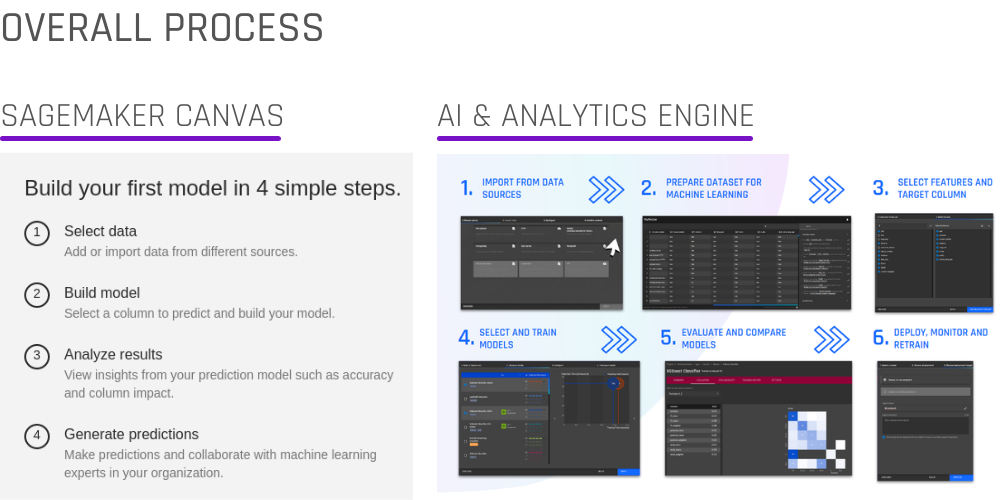
The important similarities and differences between the features of the two platforms will be explored in this article. Let us first begin with a short comparison highlight, followed by a detailed walk-through.
|
Feature |
SageMaker Canvas |
AI & Analytics Engine |
||
|---|---|---|---|---|
|
Data Import |
File Sources |
Local |
|
|
|
S3 |
|
|
||
|
Snowflake |
|
|
||
|
RedShift |
|
|
||
|
Web (HTTP) |
|
|
||
|
MySQL |
|
|
||
|
PostgreSQL |
|
|
||
|
MongoDB |
|
|
||
|
File Formats |
CSV |
|
|
|
|
JSON |
|
|
||
|
Parquet |
|
|
||
|
Excel |
|
|
||
|
Flexible configuration (file reading) |
|
|
||
|
Data Preparation |
Full Capability (reshaping, filtering, aggregation, custom formulas, etc.) |
|
|
|
|
Joining Multiple Datasets |
|
|
||
|
Task Types |
Classification |
|
|
|
|
Distinction between binary and multi-class classification |
|
|
||
|
Regression |
|
|
||
|
Univariate Time Series Forecasting |
|
|
||
|
Grouped Time Series Forecasting |
|
|
||
|
Model Training |
Algorithm Selection |
|
|
|
|
Model Preview |
|
|
||
|
Automatic configuration of training resources |
|
|
||
|
GPU Acceleration |
|
|
||
|
ML Ops |
Model Performance Report (for non-Data Scientists) |
|
|
|
|
Model Performance Report (for Data Scientists) |
|
|
||
|
Multiple models per task |
|
|
||
|
Model Comparison |
|
|
||
|
Column Impact report (Feature Importance) |
|
Planned for future release |
||
|
ROC and PR curves for classification |
|
|
||
|
Batch Prediction |
|
|
||
|
Individual Prediction (What if… scenarios) |
|
|
||
|
Flexible Deployment Options |
|
|
||
|
API endpoint |
|
|
||
|
Developer SDK support |
|
|
||
|
Monitoring |
|
|
||
|
Continuous learning automation based on updates to the training dataset |
|
|
||
|
Administrative tools |
Organizations |
|
|
|
|
Projects |
|
|
||
|
Multiple users per organization |
|
|
||
|
Multiple users per project |
|
|
||
|
External users |
|
|
||
From the table, it is clear that the AI & Analytics Engine is more suited to help users with the most difficult and time-consuming task in the building of an end-to-end ML pipeline: importing data from heterogeneous sources and preparing them using a wide variety of data transformations (recipe actions).
On the other hand, with SageMaker Canvas, the uploaded data has to come in quite clean. The only data preparation action provided by SageMaker Canvas is the joining of datasets.
Should your data need to be prepared with greater flexibility, you would have to rely on the other tools within the AWS ecosystem, such as AWS Glue DataBrew. If using that, you would run data transformation pipelines there, export the data to Amazon S3, and then import the data into SageMaker Canvas from Amazon S3. Not an impossible task, but all in all, quite arduous. This is not the case with the AI & Analytics Engine. The Engine provides seamless connectivity between data preparation, feature engineering, and model training. Hence, you can carry out the end-to-end process without having to switch between tools.
Another important distinction between SageMaker Canvas and the Engine is the way in which the concept of a “Model” exists. With SageMaker Canvas, you can only build one model per task defined by the choice of dataset and target column. On the other hand, with the AI & Analytics Engine, you define a prediction task as an “App”, where you can select the data and target columns. The App will then be built with a train/test split, where multiple models can be built using the train portion and evaluated on the test portion so that they can be compared fairly.
The AI & Analytics Engine also places more importance on MLops, which involves deploying and maintaining models at scale in production, as well as providing flexible integration options such as API endpoints to invoke predictions from the model. These functions are currently not available on SageMaker Canvas.
Finally, on the Engine, you can organize your work into different types of spaces like organizations and projects. These are shared spaces for businesses or groups. Multiple users can work together within an organization or project on the platform. External users can also be invited to work in a specific project space as well. This feature allows users to work collaboratively with other stakeholders or teammates. Individual users can also use these shared spaces to organize their different projects. These administrative functions are not yet available on SageMaker Canvas.
We conducted a trial run of the SageMaker Canvas for binary classification, multi-class classification, and regression ML problem types, using the following datasets:
|
Problem Type |
Dataset |
|---|---|
|
Binary classification |
Breast Cancer dataset |
|
Multi-class classification |
Iris flowers dataset |
|
Regression |
Boston housing dataset |
The following sub-sections detail the process for different stages in the end-to-end workflow of building an ML model:
Step 1: Logging In
The first step is to log in to the platform and navigate to the appropriate tool. For SageMaker Canvas, you will first need to log in to AWS console, using your AWS credentials. You then have to use the search bar to search for SageMaker Canvas. This is then followed by a series of configuration steps, before you are taken into the tool.
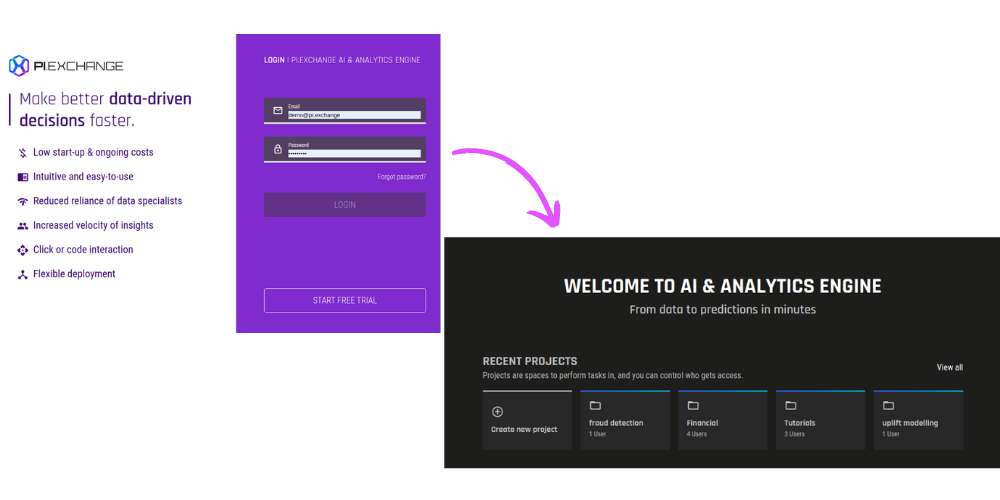
The AI & Analytics Engine boasts a simple and fuss-free log-in process. Simply log in with your credentials (email address and password). Once you're on the platform, click on “Create Project” or any of your existing project(s) to start uploading data and building models. Easy.
Step 2: Importing Data
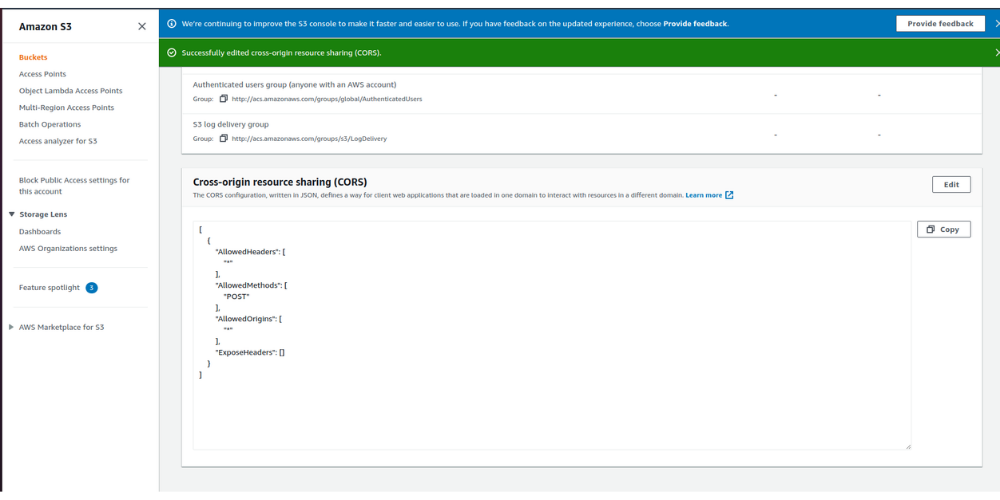
As a first step, SageMaker Canvas asks you to upload data. We attempted to upload a file directly. To do so, AWS advised us to enable certain permissions by editing a JSON text field on the AWS S3 management console:
However, we still could not get the file upload to work:
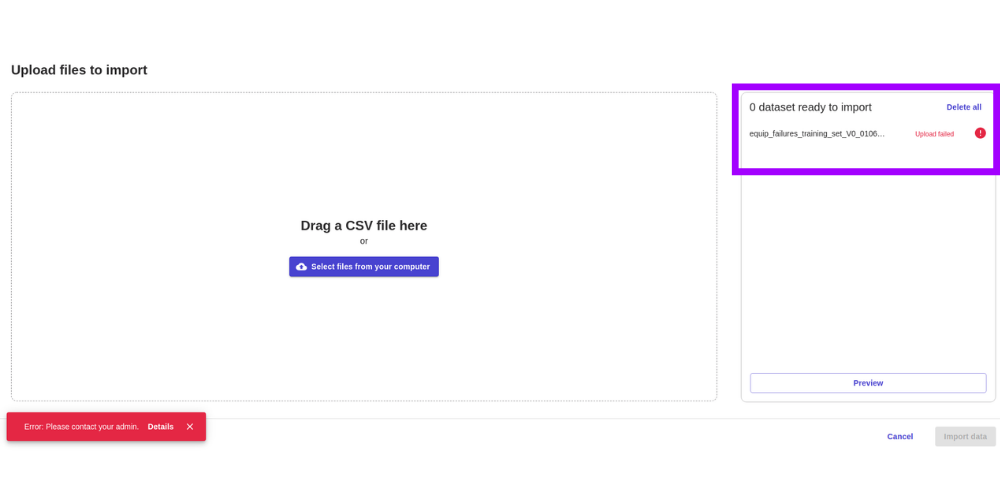
Hence, we resorted to:
Uploading the file to AWS S3
Importing it into SageMaker Canvas from AWS S3
Despite not being very straightforward, this process worked. Upon clicking on the chosen CSV file on S3, we are shown a preview of the dataset (below). Once the import process is completed, one can directly build models.
-png.png)
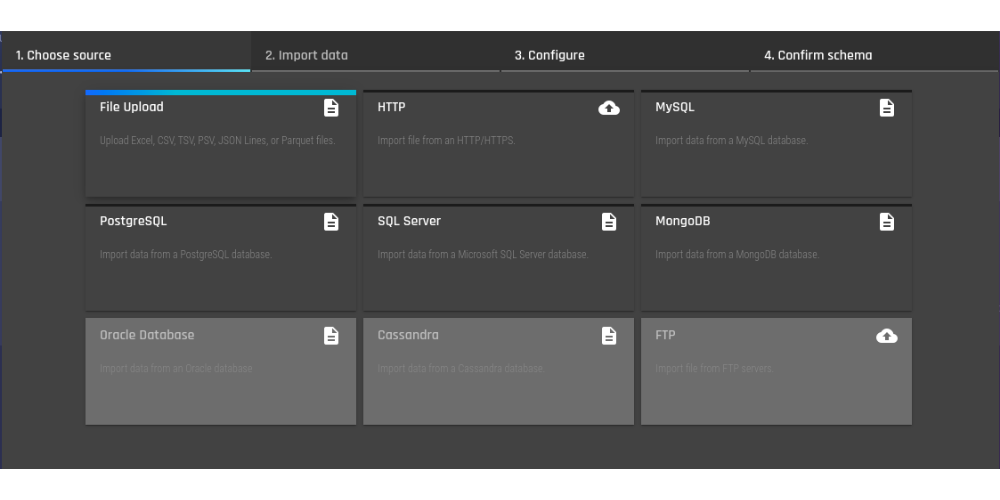
On the AI & Analytics Engine, multiple types of data sources are supported, of which “file upload” is one. All you have to do is simply drag and drop your file.
The important difference comes at this stage. On the AI & Analytics Engine, the user can choose flexible configuration options, the column names are automatically cleaned, and the schema can be adjusted. A preview is shown alongside so that users can see the effect of choosing a particular configuration:
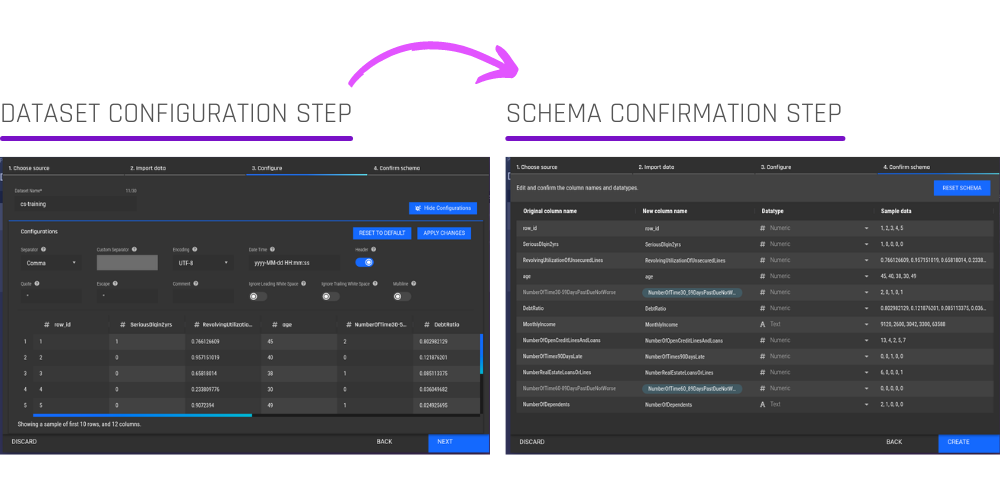
The Engine suggests sensible defaults as “recommended settings to be applied”, depending on the scenario. If these defaults are good, the user can simply click on “Next” without having to manually enter anything. At the same time, the user has full flexibility and control, should they wish to make any changes.
There is no such flexible manual control possible on the SageMaker Canvas. Hence, non-standard CSV parsing, etc. are not supported. As mentioned before, our Engine supports multiple file formats, whereas SageMaker Canvas only supports (standard) CSV.
Step 3: Creating Models
When it comes to creating models, AWS SageMaker Canvas provides a truly easy way to do so. Simply choose the dataset and the target column. An optional third step is where you can choose the model type.
-png.png)
-png.png)
On the AI & Analytics Engine, you start with the dataset’s details page, from which you will create an App. From there, you will go on to create a feature set and select the models that you want to train.
-png.png)
SageMaker Canvas provides a “Preview” for each model, where it estimates the performance of the model, if built, on the test set, as well as the impact of each column:
-png.png)
This is not yet available on the AI & Analytics Engine but is slated for upcoming releases. However, the predicted performance is shown against each algorithm, where the Engine provides greater flexibility for technical users, like Data Scientists, to choose the preferred algorithms by themselves:
-png.png)
For the process of building (and training) models on SageMaker Canvas, there are a few key points and limitations to understand:
For small datasets, the training time and prediction quality are similar:
|
Dataset Details |
Training times |
Predictive Performance (Quality) |
||
|---|---|---|---|---|
|
AWS SageMaker Canvas |
AI & Analytics Engine |
AWS SageMaker Canvas |
AI & Analytics Engine |
|
|
BreastCancer.csv 699 rows, 11 columns |
1 min |
35 sec |
94.3% |
94.6% |
However, even for not-so-large datasets (> 50,000 rows), the model building process failed on SageMaker Canvas, with the following message after 1 hour and 23 minutes:
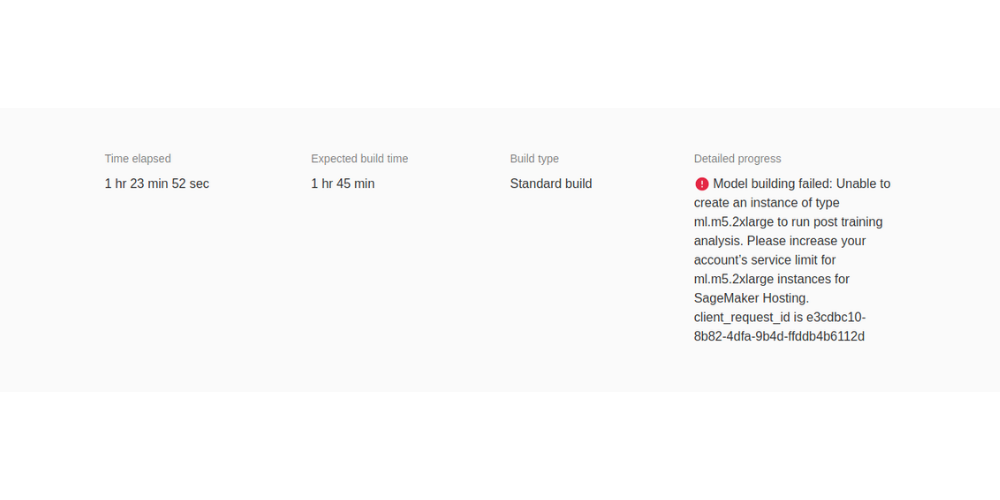
It is evident that training more than 50,000 rows requires provisioning more resources manually, which needs to be done outside SageMaker Canvas, and on the AWS console.
Compared to this, on the AI & Analytics Engine, the model training process was completed successfully in less than 5 minutes:
-png.png)
The predictive performances of the resulting models were also high, around 85 - 89 %.
Further limitations of SageMaker Canvas are:
You can’t build a model with less than 250 rows. Hence, we had to triple the number of rows in the Iris flowers dataset simply by replicating each row three times. On the AI & Analytics Engine, no such limitation exists.
The “quick build” option is available only for datasets less than 50,000 rows in size
Step 4: Model Overview
On SageMaker Canvas, one can see column impact values:
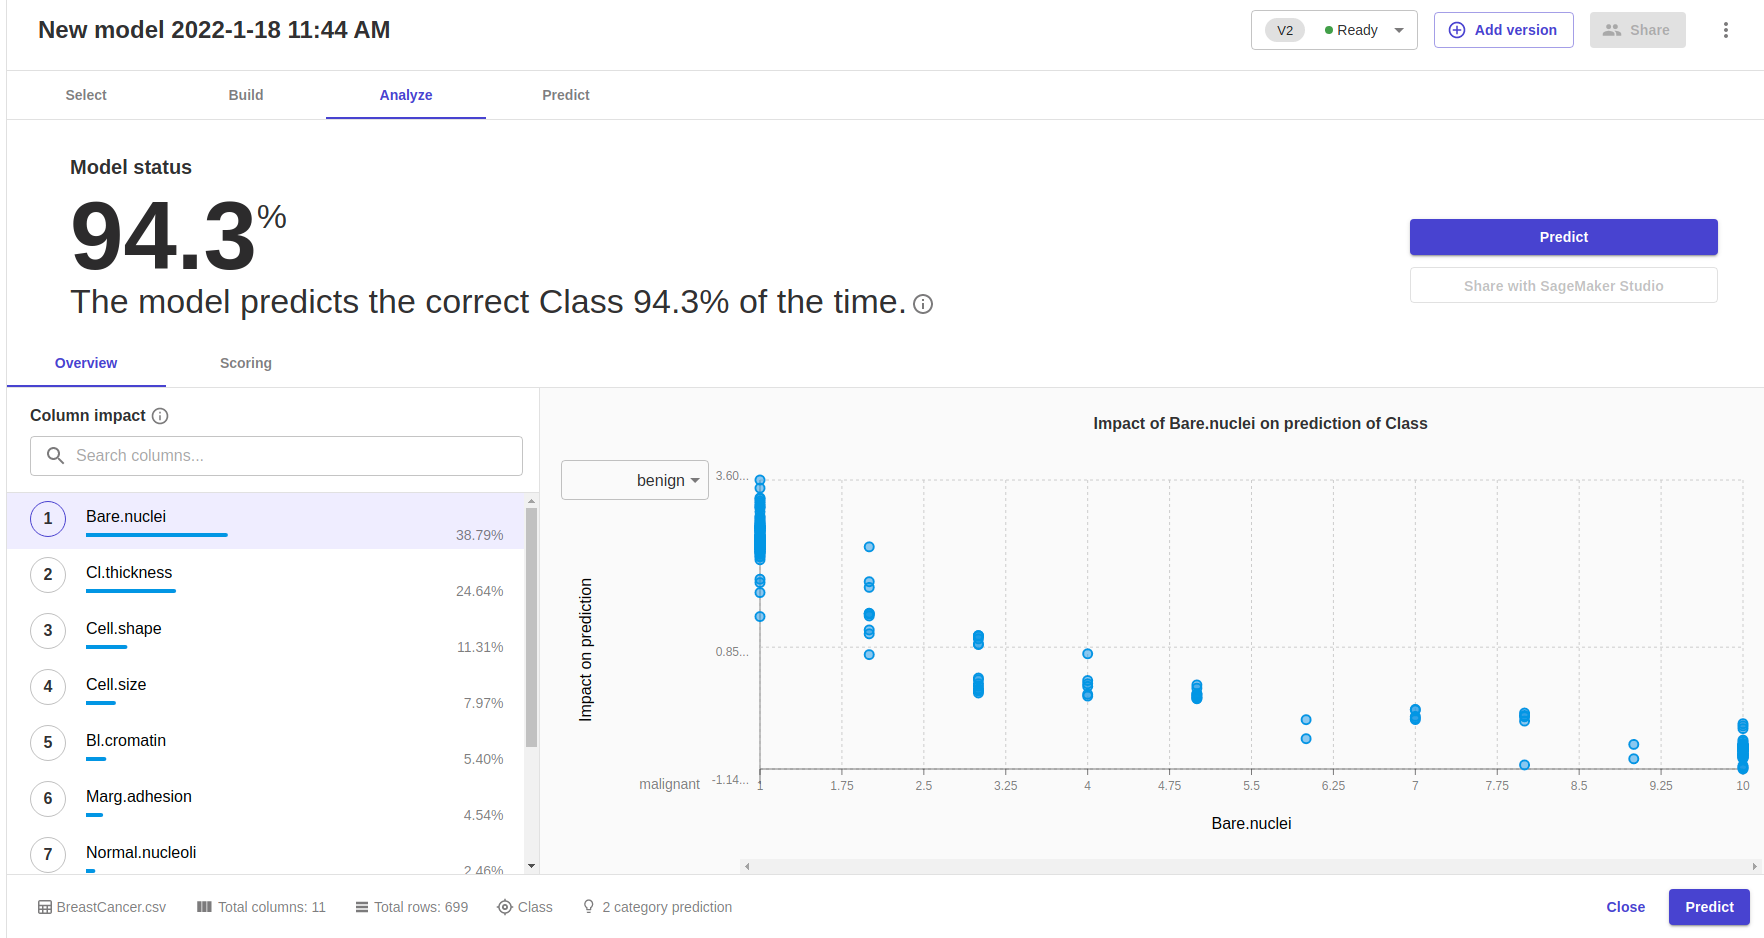
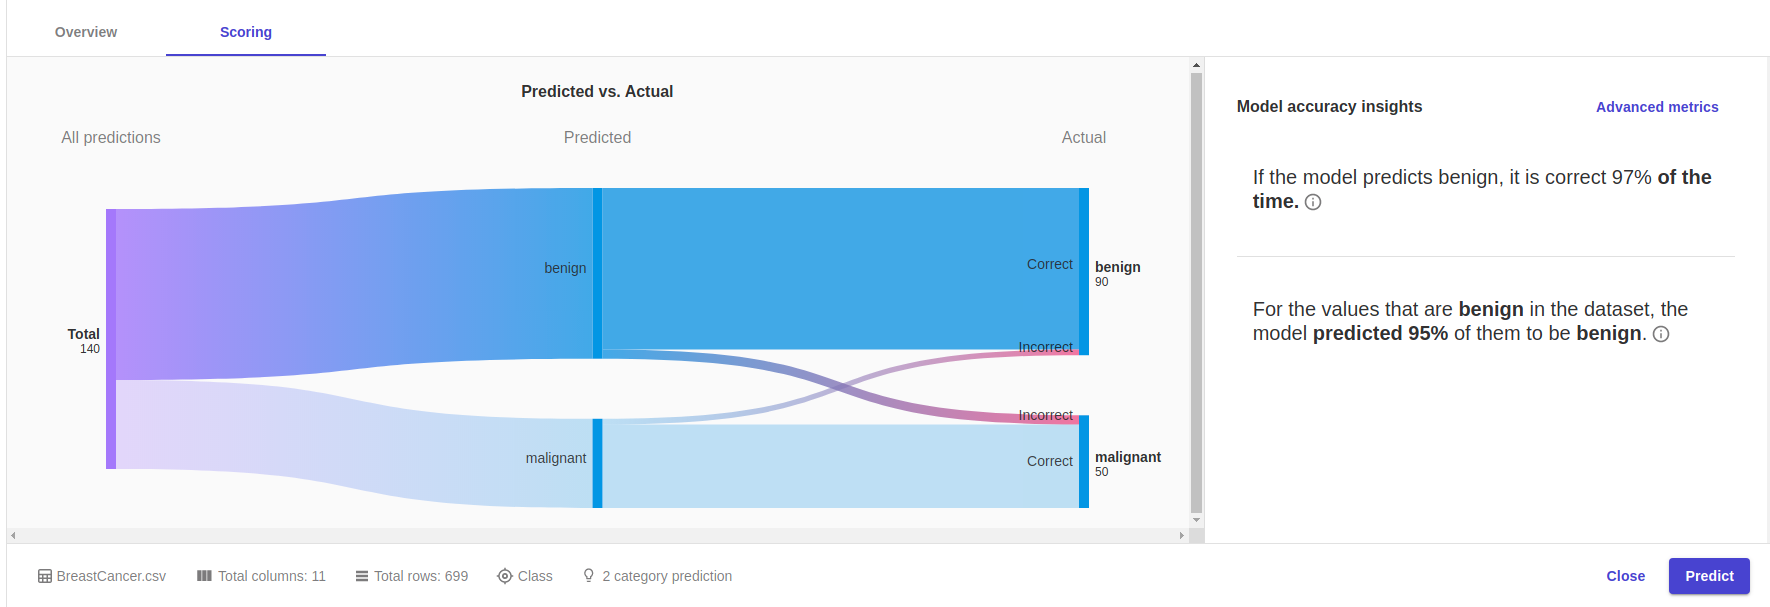
On the “Scoring” tab, we can see the model’s performance:
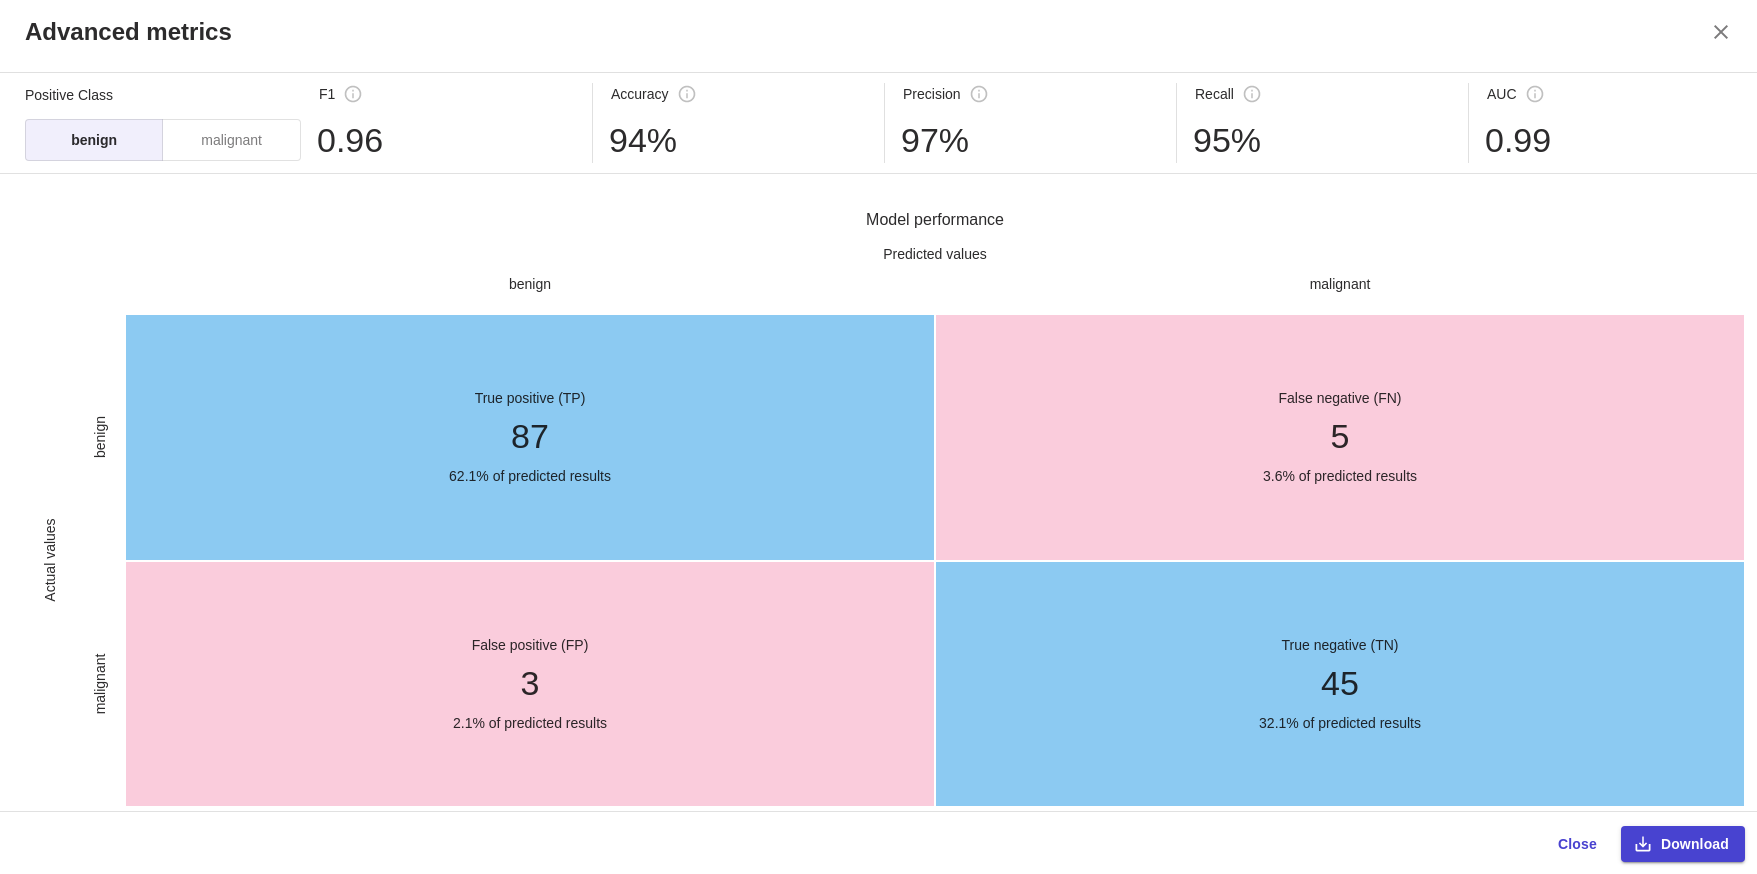
There is also an “Advanced” option that shows greater detail that is familiar to data scientists:
On the AI & Analytics Engine, confusion matrix, ROC, and PR curves are currently available for classification models, along with a table of different metrics. This view is familiar to data scientists:
-png.png)
-png.png)
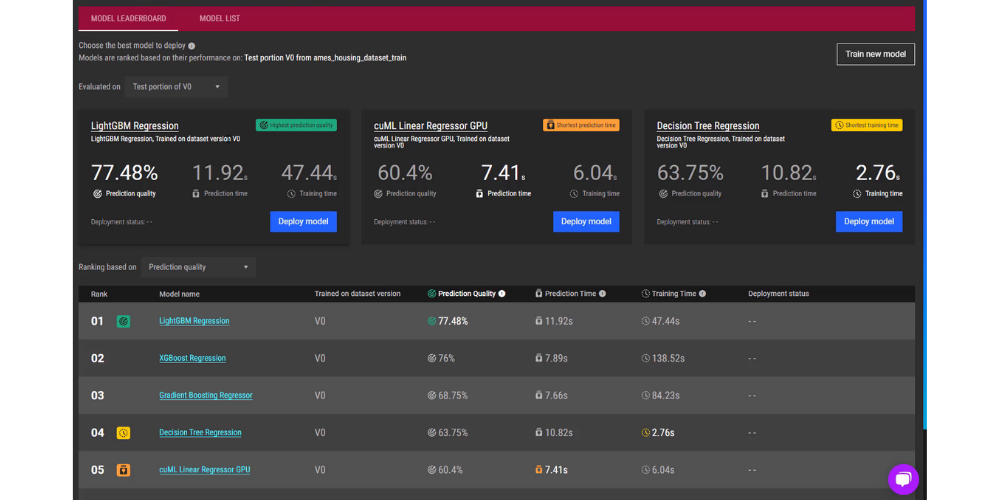
The Engine comes with a Model Leaderboard feature. The Model Leaderboard shows users a summary of their trained models and ranks them according to their performance. The model rankings are based on prediction quality, prediction time, and training time. This allows users to identify the appropriate model to deploy for their needs.
Step 5: Prediction
On SageMaker Canvas, once a model is built, you can obtain predictions in two ways:
Single prediction (Analyzing “what if…?” scenarios)
Batch predictions
-png.png)
-png.png)
On the AI & Analytics Engine, a trained model needs to be deployed before predictions can be called via an API endpoint:
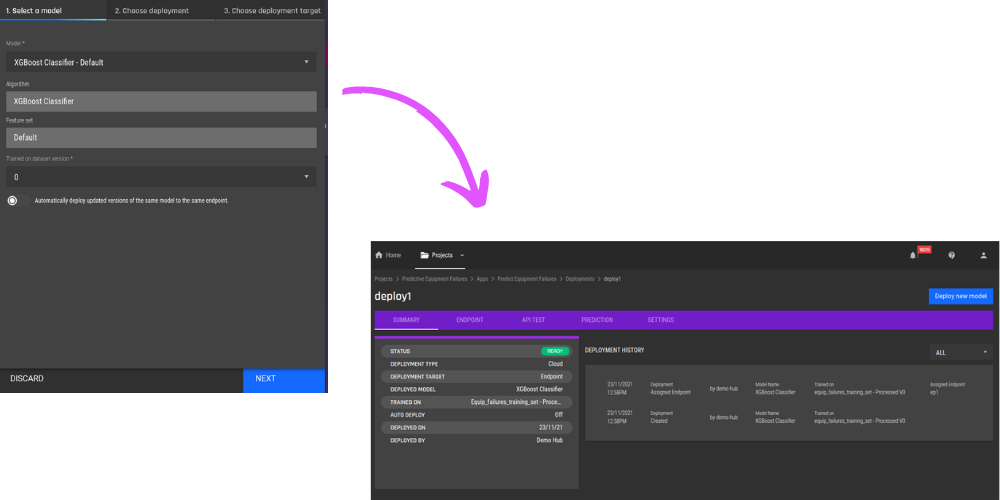
You can then get a sample code for invoking predictions via the model’s deployment to an endpoint:
-png.png)
The Engine also offers a batch prediction option under the deployment. As for single predictions, they can be obtained via the “API test” function in the UI, where comma-separated values can be entered for the input features to obtain a prediction. A full GUI support for single predictions (“what if…” scenarios) will be available in the upcoming release of the Engine.
-png.png)
-png.png)
Initially, we had trialed SageMaker Canvas, using a $100 credit that they had generously provided to us. While using the platform, I received an email notifying me that I had used up 85% of my credit. Naturally, I thought that I would be provided with a prompt that I had run out of credits. Unfortunately, no such prompt or notification was provided by them, so I went along assuming I was still running on my credit.
After completing my time on the platform, I received a usage bill of USD$373 (after deducting my credit). I had used up more than my credit on the platform. This would have been understandable if there had been any indication or notification from them that I had run out of credit. All that for creating 5 models, of which 2 had failed to train.
Lesson to learn: If you're using SageMaker Canvas on credit, keep an eye on it!!
AWS SageMaker Canvas is a new AIaaS platform released by AWS, intended for use by non-technical users in businesses needing to build predictive models. The AI & Analytics Engine provides comparable features but is more stable and robust for building models on large datasets. It also provides more flexibility to users to choose different algorithms for training models, as well as in deploying and managing models. Additionally, the Engine offers better data-preparation features compared to SageMaker Canvas, helping users with the most time-consuming task of building their ML pipelines.
Not sure where to start with machine learning? Reach out to us with your business problem, and we’ll get in touch with how the Engine can help you specifically.
In this blog, we’ll show how to import data using the AI & Analytics Engine’s Google Sheets integration, so you can build machine learning models.
How does the H2O Driverless AI add up when compared to the AI & Analytics Engine? Let’s find out in this comparison blog looking at both AutoML...
In this comparison article, we look at two powerful Machine Learning solutions, Dataiku and PI.EXCHANGE'S AI & Analytics Engine.