We are excited to announce the latest release of the AI & Analytics Engine - 1.7.0. In this release, we would like to introduce Clustering - an unsupervised machine learning (ML) technique that can determine the intrinsic groupings among unlabeled data. Additionally, we introduce better capabilities for exploratory data analysis, and more!
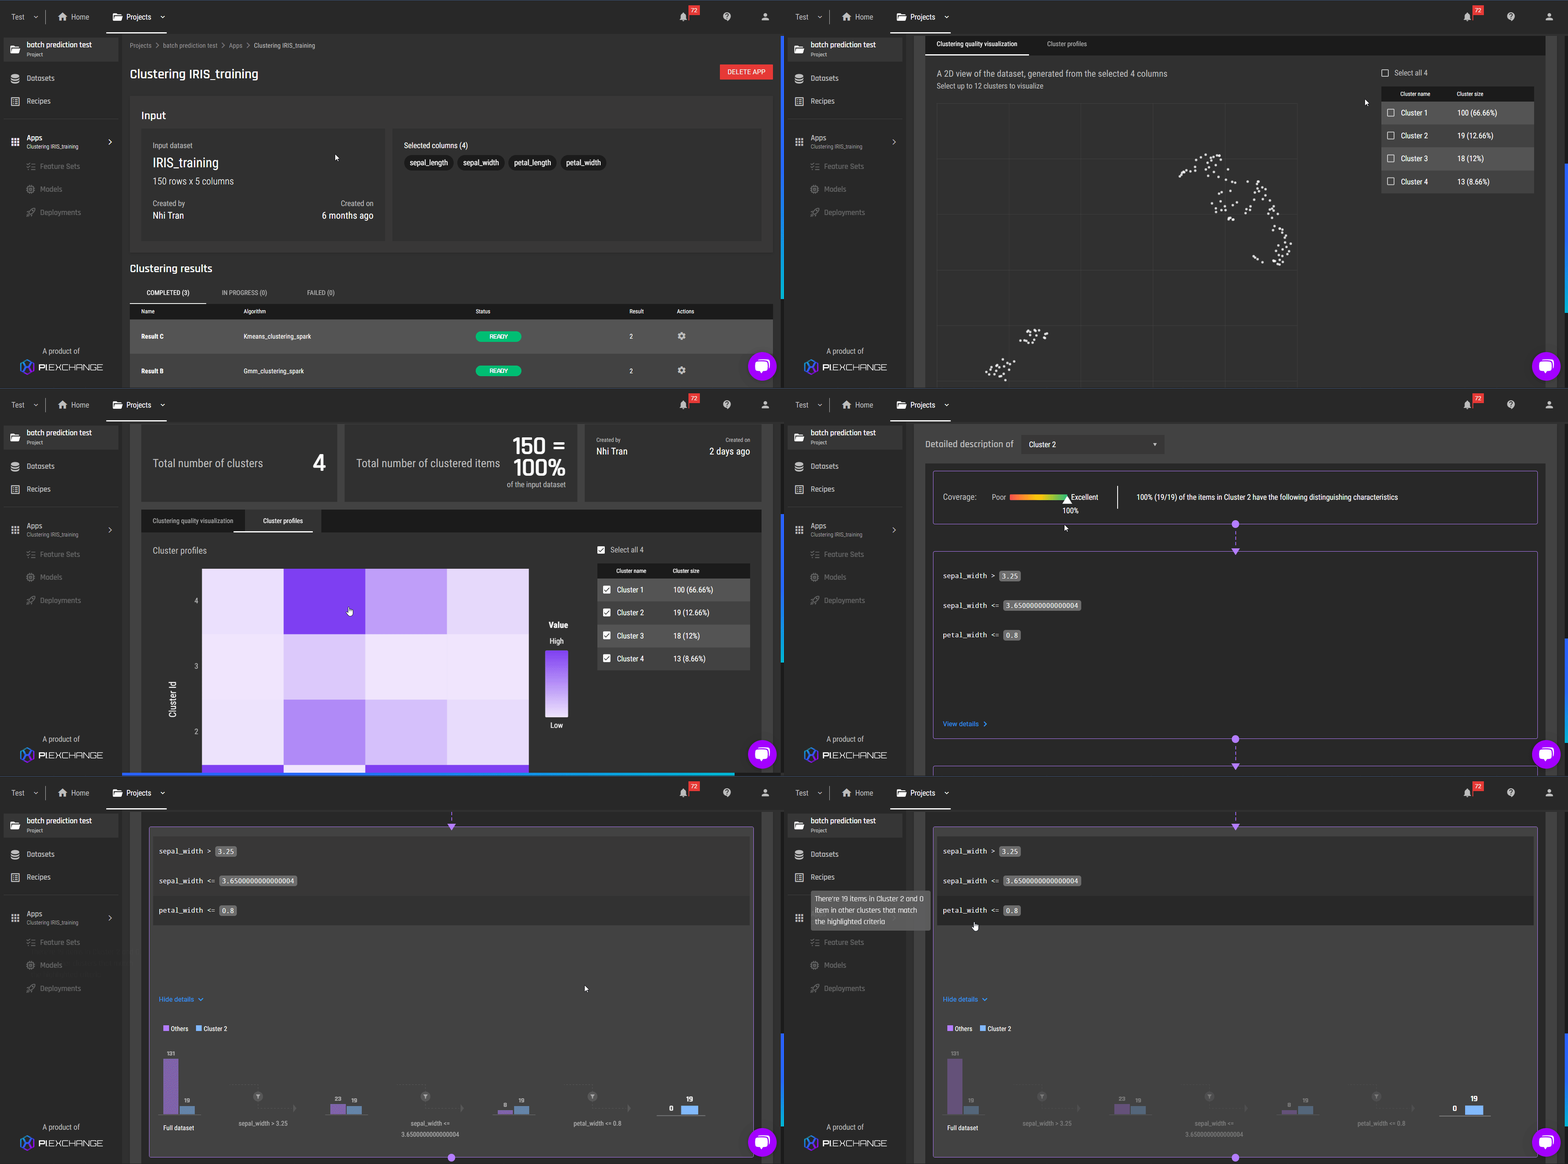
Clustering - Discover natural groups of similar items
In accordance with its “natural-pattern learning” capability, machine learning can be applied to discover natural groups of similar items. In the Engine, you can:
-
Specify the columns to be used as criteria to identify the similarities among different occurrences that best serve your use case
-
Select and configure options to produce desirable results relevant to your own purposes. We support three state-of-the-art algorithms:
a. HDBSCAN for datasets up to 100,000 rows,
b. and K Means and Gaussian Mixture Modelling for any data size - up to even a million rows or more.
-
Analyze the similarities of the items belonging to the same cluster to identify the next steps in your workflow

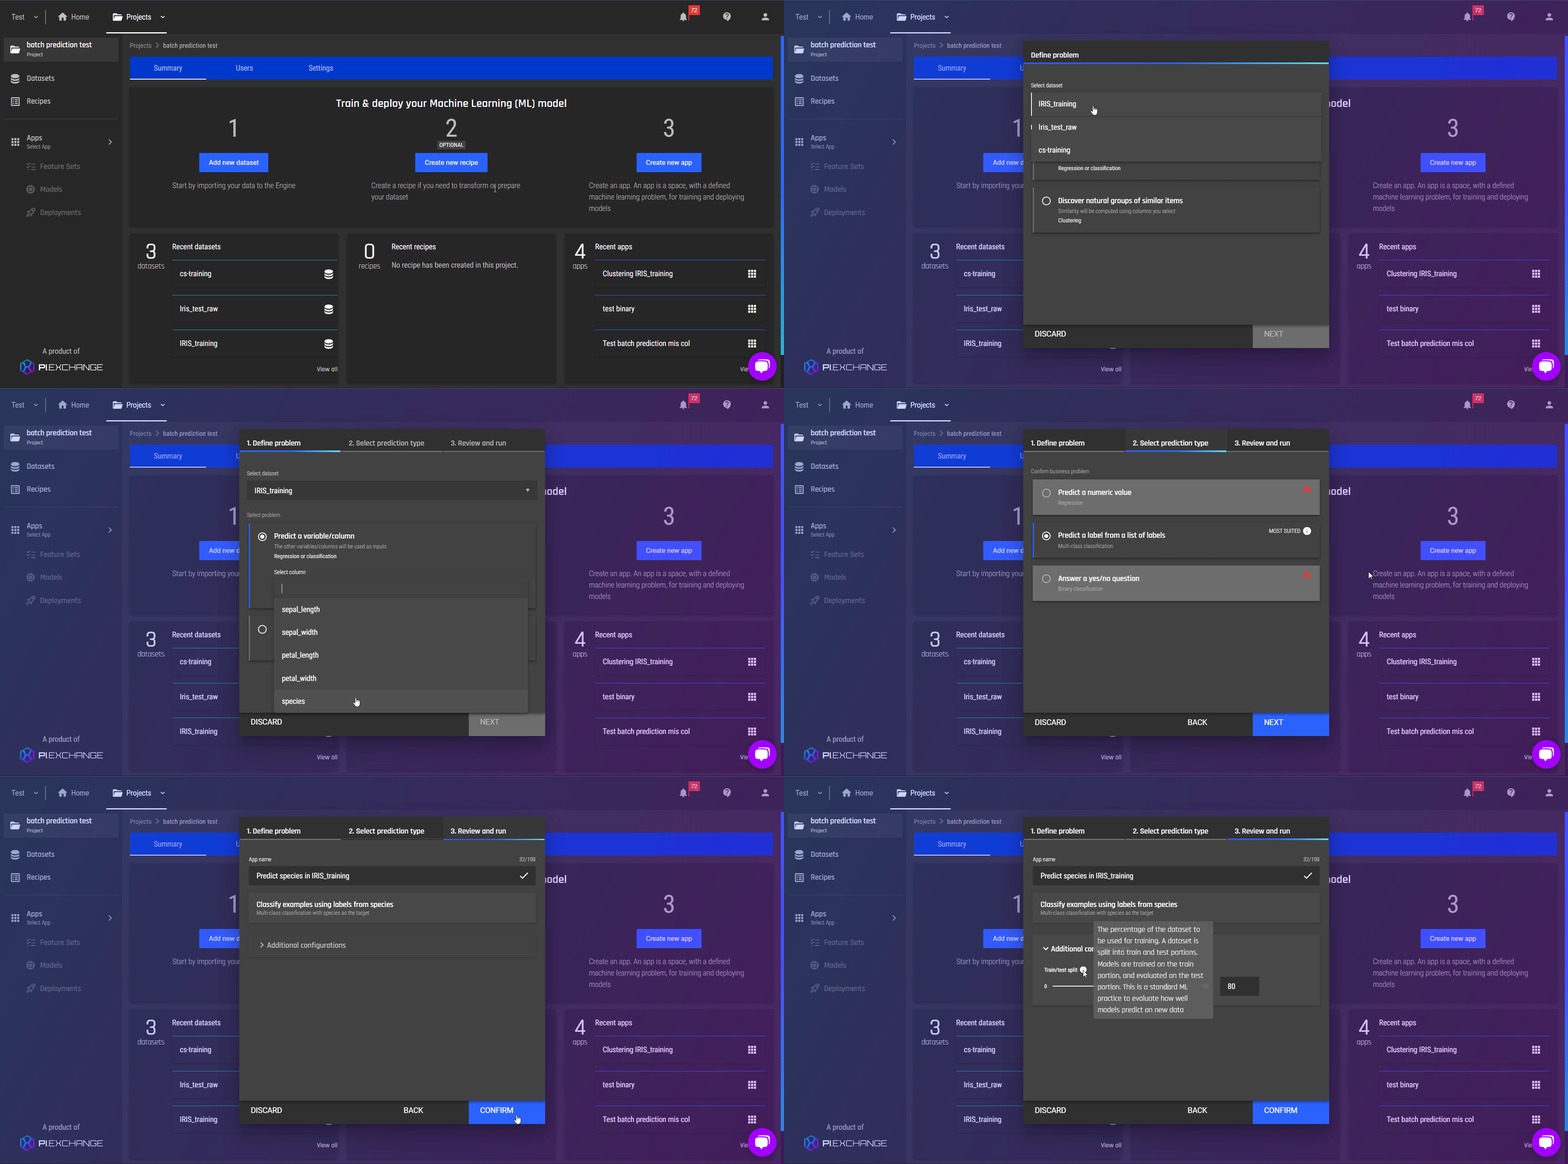
Smart prediction type detection, for supervised machine learning problems
In this release, we improve the logic to detect the best-suited type of predictions among regression, binary and multi-class classifications. As you select “Predict a variable/column” and specify the target column, the Engine will provide guidance and introduce the best-suited type of prediction. You can review and confirm the recommendation, or simply select other enabled options. By improving the logic, we hope to:
-
Give you the most friendly guidance and automation,
-
Reduce the probability of errors and failures down the line to ensure a smooth workflow for you,
so that users who are not familiar with data science terminologies, such as binary classification or regression, will still be able to get the best outcome for their task.

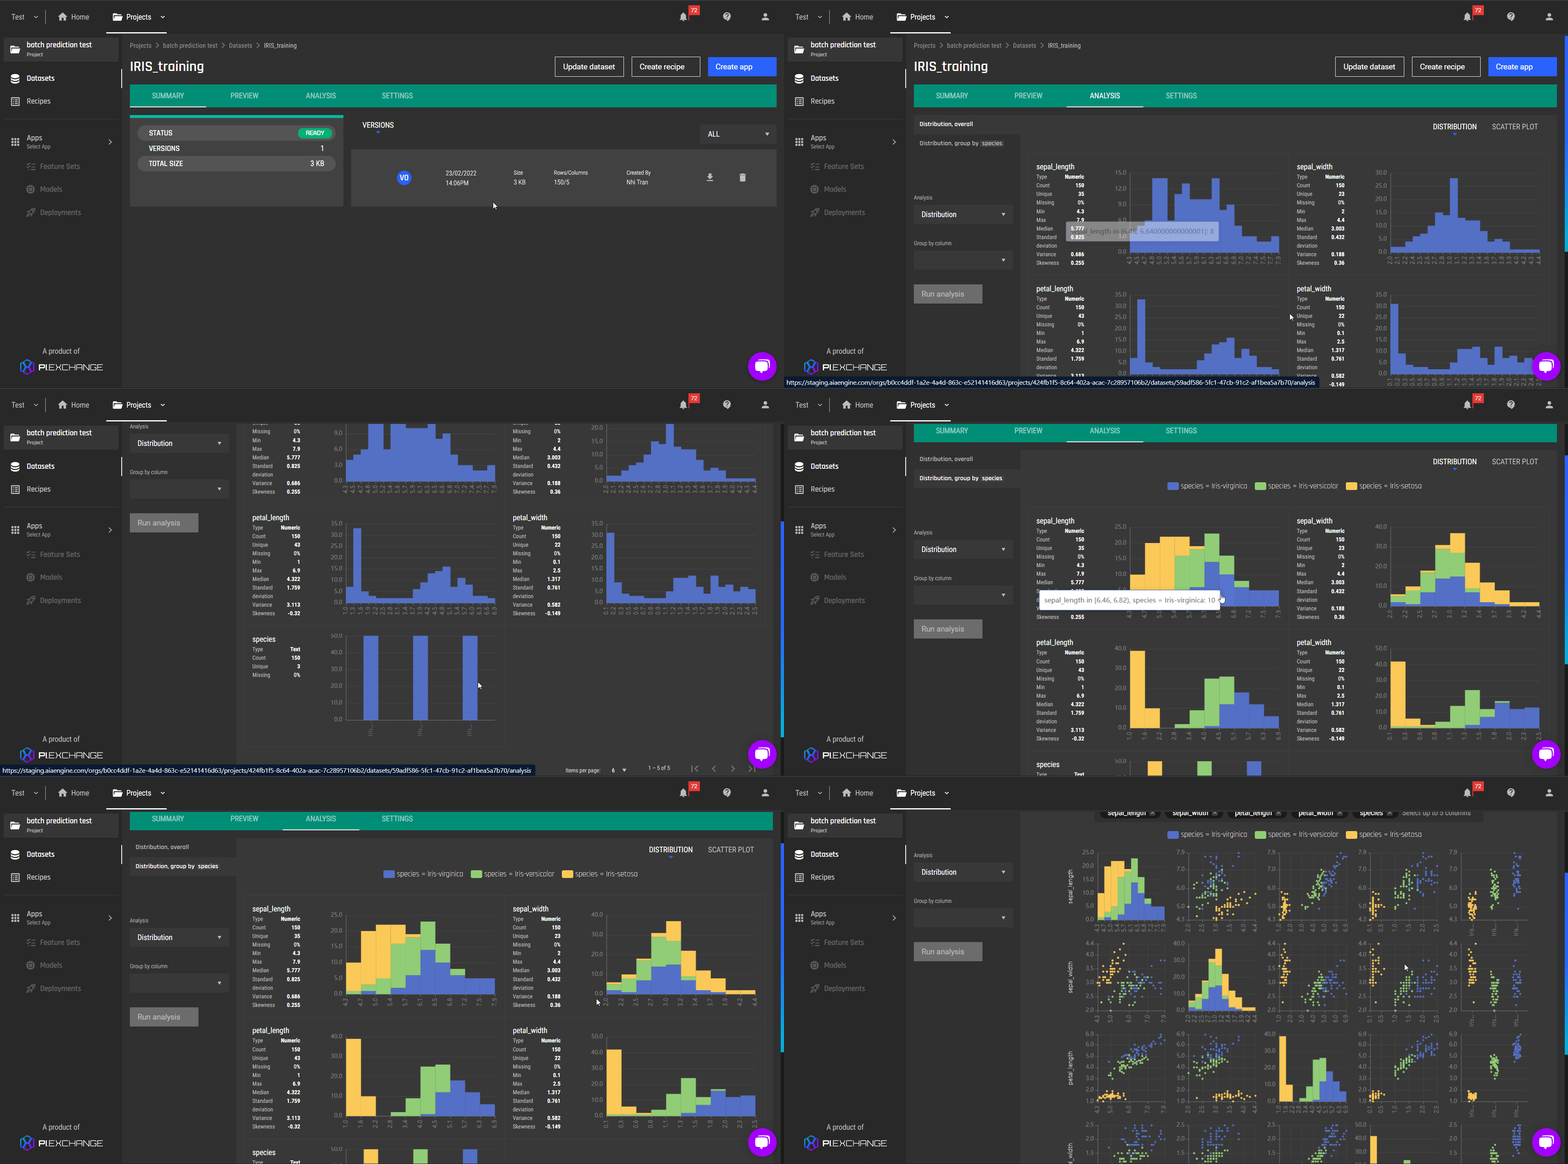
Improvements in data analysis
In addition to improving the user interface of data analysis, we also introduce a new feature where you can:
-
View column distributions split by a categorical column, on demand
-
View pair plot of up to 5 columns at a time

Want to give these new features a go? Sign up for your 2-week trial now!
